LESSON 5
TOPIC: Data Presentation: Ordered presentation of data or frequency table.
CONTENT:
i. Data and Types of Data
ii. Ordered Presentation of Data
iii. Frequency and Frequency Table
iv. Class Interval (Groups)
Topic 1: Data and Types of Data
The word data means information, which are usually given in the form of numbers or facts. Data may be categorized into
a) Qualitative / categorical data. They are non numerical and are described only in words. Examples are names, places, color, taste, opinions, brightness and so on.
b) Quantitative data: They are numerical data which are usually given in form of a number or measurement. Examples are number of cars, height of people, number of schools, number of admissions, etc. Quantitative data can be further classified into:
i) Discrete data: They are obtained usually by counting and not by measurements. Most often they are whole numbers and not fractions / decimal numbers. The sense is that we can only say we have 6 houses and not 6 ½ houses; we have 4 boys and not
4 3/4 boys. Thus, discrete data have certain definite or exact values.
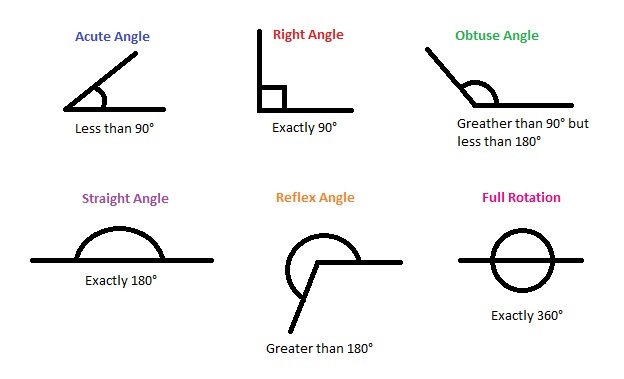
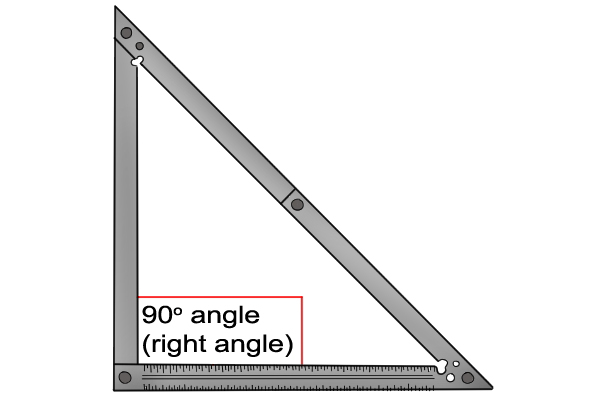
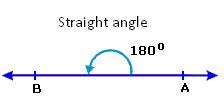
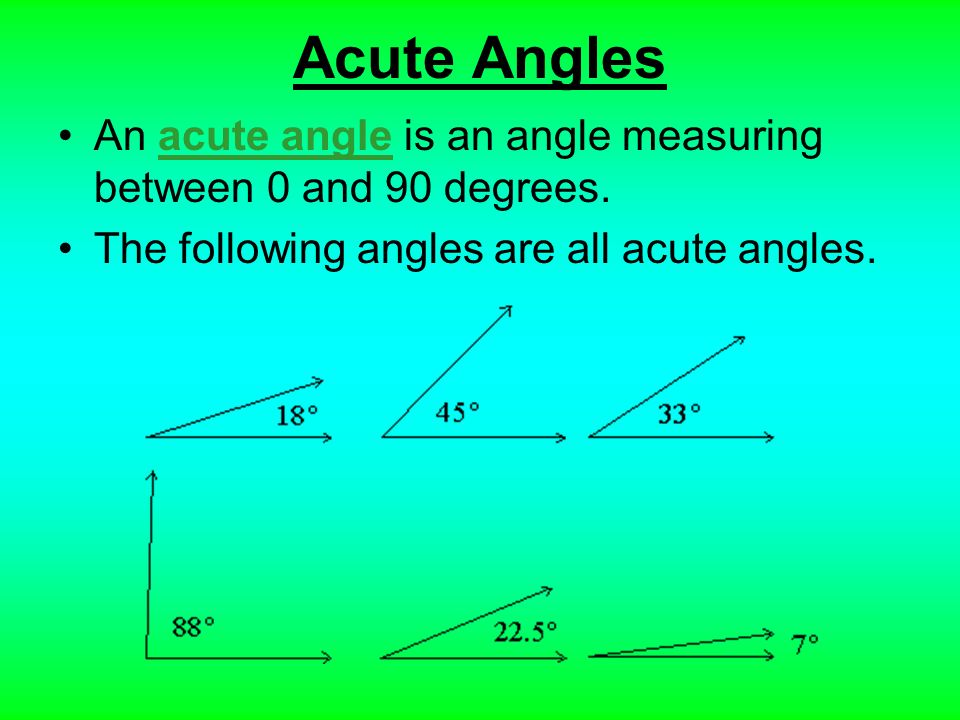
ii) Continuous data: They are data which are obtained by measurements. They can take any values within a given range, including fractions and decimals. Continuous data concerns more with precision of figures or numbers’ measurements, perhaps using instrument. Examples of continuous data are heights, distances, temperature, areas, perimeters, volumes, density, mass, angles, etc. This is so because these may not be whole numbers in most practical situations.
https://youtu.be/7bsNWq2A5gI
EVALUATION:
What is Data
Mention the various categories of Data
LESSON 6
Topic 2: Ordered Presentation of Data
Ordered Presentation of data is the arrangement of data in a way that will make them look organized and more presentable. Ordered presentation of data also makes statistical data easy to read, understand and interpret. Data containing numbers can be presented in an ordered format through:
i. Sorting
ii. Use of frequency table
Data can also be presented using graphs.
Sorting
This involves arranging data either from the least to the highest (increasing or rank order) and vice versa. When data are not sorted out and not arranged to taste, we say they are still in the raw state and are therefore called as raw data.
Data sorted out in increasing order are said to be given in Rank Order. In a Rank Order, the Range of the set of data can be calculated.
https://youtu.be/0ZKtsUkrgFQ
Range --- The range of any set of data is the difference between the largest value and smallest value. For instance, given the set of numbers:
5, 8, 3, 2, 17, 9, 13, 6, 4
Range = 17 – 2 = 15
Sometimes the range is written as 2 → 17, meaning that the data ranges from 2 to 17.
Example:
Question: The raw scores of 20 pupils in a Mathematics test are:
6, 8, 10, 5, 2, 10, 6, 9, 4, 3, 10, 5, 6, 9, 8, 7, 7, 6, 6, 3
(a) Arrange the scores in the order of magnitude starting with the smallest.
(b) Arrange the scores in the order of magnitude starting with the largest.
(c) What is the difference between the least and the highest scores?
(d) How many pupils scored less than 6?
(e) How many pupils have the lowest score; and how many have the highest score?
(f) If the pass mark is 7 how many failed and how many passed?
Solution:
2, 3, 3, 4, 5, 5, 6, 6, 6, 6, 6, 7, 7, 8, 8, 9, 9, 10, 10, 10
10, 10, 10, 9, 9, 8, 8, 7, 7, 6, 6, 6, 6, 6, 5, 5, 4, 3, 2, 2
Range = Highest score – Lowest Score
= 10 – 2
= 8
Less than 6 = Numbers from 2 to 5
2, 3, 3, 4, 5, 5
Therefore 6 pupils scored less than 6 marks
Lowest score = 2, Therefore 1 pupil has the lowest score
Highest score = 10, Therefore 3 pupils have the highest score
Pass mark = 7 or more,
Pass scores = 7, 7, 8, 8, 9, 9, 10, 10, 10. Therefore 9 pupils passed
Fail mark = Less than 7
Fail scores = 2, 3, 3, 4, 5, 5, 6, 6, 6, 6, 6. Therefore 11 pupils failed
https://youtu.be/estOLtAfUQ8
EVALUATION:
Question: The raw scores of 20 pupils in a Basic Science test are:
16, 8, 10, 5, 4, 20, 16, 9, 14, 13, 10, 5, 6, 19, 28, 12, 17, 22, 11, 13
(a) Arrange the scores in the order of magnitude starting with the smallest.
(b) Arrange the scores in the order of magnitude starting with the largest.
(c) What is the difference between the least and the highest scores?
(d) How many pupils scored less than 20?
(e) How many pupils have the lowest score; and how many have the highest score?
(f) If the pass mark is 15 how many failed and how many passed?
LESSON 7
Topic 3: Frequency and Frequency Tables:
The frequency of a particular data value is the number of times the data value occurs. For example, if four students have a score of 80 in mathematics, and then the score of 80 is said to have a frequency of 4.
The frequency of a data value is often represented by f.
A frequency table is constructed by arranging collected data values in ascending order of magnitude with their corresponding frequencies. This table shows the arrangement of data in at least two columns, where the first column indicates the items from the least to the highest and the second column indicates the frequencies. There can also be the third column for tally.
In general:
We use the following steps to construct a frequency table:
Step 1:
Construct a table with three columns. Then in the first column, write down all of the data values in ascending order of magnitude.
Step 2:
To complete the second column, go through the list of data values and place one tally mark at the appropriate place in the second column for every data value. When the fifth tally is reached for a mark, draw a horizontal line through the first four tally marks as shown for 7 in the above frequency table. We continue this process until all data values in the list are tallied.
Step 3:
Count the number of tally marks for each data value and write it in the third column.
For example, the 20 raw scores of students given below can be re-organized in a frequency- table:
2, 3, 3, 4, 5, 5, 6, 6, 6, 6, 6, 7, 7, 8, 8, 9, 9, 10, 10, 10
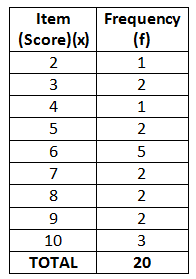
There may also be the third column for tally.
https://youtu.be/pNbqL-ysliI
EXAMPLE - 1
The marks awarded for an assignment set for a Year 8 class of 20 students were as follows:
6 7 5 7 7 8 7 6 9 7 4 10 6 8 8 9 5 6 4 8
Present this information in a frequency table.
Solution:
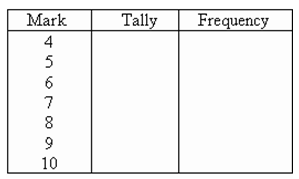
To construct a frequency table, we proceed as follows:
Construct a table with three columns. The first column shows what is being arranged in ascending order (i.e. the marks). The lowest mark is 4. So, start from 4 in the first column as shown below.
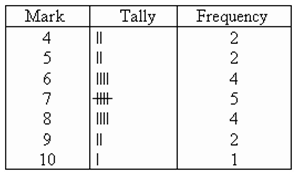
Count the number of tally marks for each mark and write it in third column. The finished frequency table is as follows:
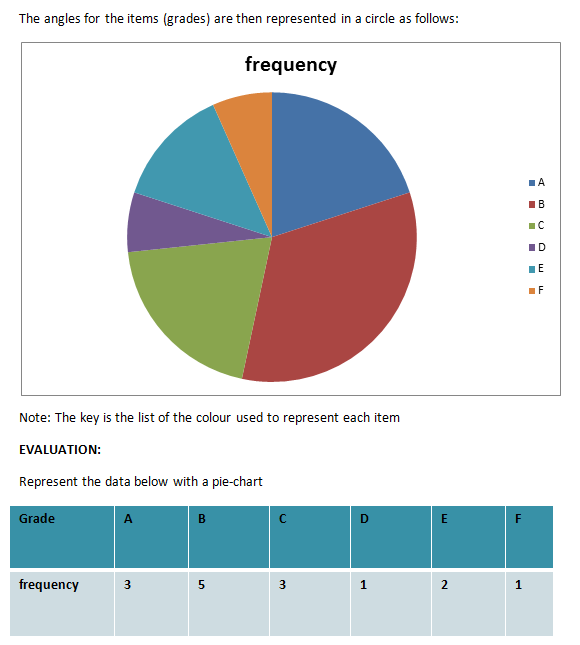
EVALUATION:
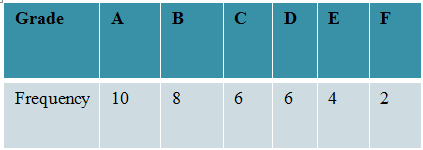
Use the frequency table to represent the table below:
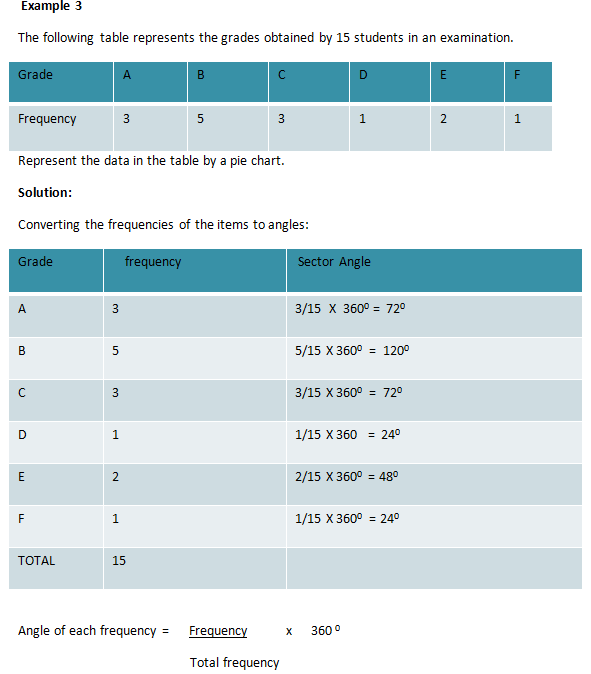
Grade A B C D E F
Frequency 10 8 6 6 4 2
 LESSON 8
Topic 4: Class Intervals (or Groups)
LESSON 8
Topic 4: Class Intervals (or Groups)
The frequency of a class interval (or group) is the number of data values that fall in the range specified by that group (or class interval). When the set of data values are spread out, it is difficult to set up a frequency table for every data value as there will be too many rows in the table. So the data are grouped into class intervals (or groups) to help us organize, interpret and analyze the data.
Ideally, there should be between five and ten rows in a frequency table. Bear this in mind when deciding the size of the class interval (or group).
Each group starts at a data value that is a multiple of that group. For example, if the size of the group is 5, then the groups should start at 5, 10, 15, 20 etc. Likewise, if the size of the group is 10, then the groups should start at 10, 20, 30, 40 etc.
https://youtu.be/L31ccw-yefc
EXAMPLE:
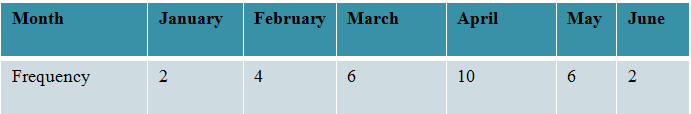
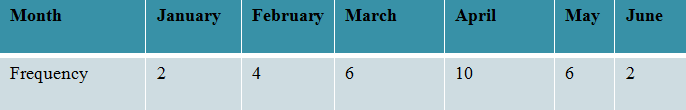
The number of calls from motorists per day was recorded for the month of December 2003. The results were as follows:
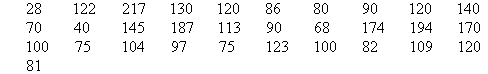
Set up a frequency table for this set of data values using class interval of 40.
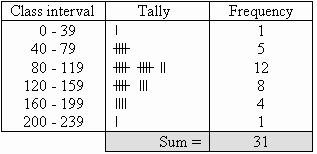
Solution:
Construct a table with three columns, and then write the data groups or class intervals in the first column. The size of each group is 40. So, the groups will start at 0, 40, 80, 120, 160 and 200 to include all of the data.
EVALUATION:
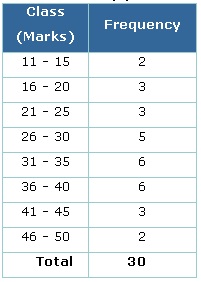
The data below represent the daily units of electricity used by a certain household in September. Represent the information by a frequency table.
25, 14, 17, 12, 8, 17, 13, 17, 4, 25, 2, 8, 15, 4, 7, 14, 18, 7, 6, 5, 28, 32, 30, 19, 11, 14, 22, 4, 11, 9.
ASSIGNMENT:
New General Mathematics for Junior Secondary Schools 2 by M.F. Macrae et. al. Review Test 8 No 1 Pages 11-12.
New General Mathematics for Junior Secondary Schools 2 by M.F. Macrae et. al. Review of previous coursework Pages 10-12.
Further Studies
Study More...

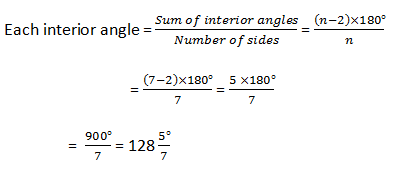
 =((n-2)×180°)/n