SCHEME OF WORK
WEEK TOPIC
1. Revision of work done in the second term
2. Angles: Sum of angles of a convex polygon – the sum of the interior angles of a convex polygon.
Using angles of elevation and depression in calculating measurements.
The difference between angles of elevation and depression.
Solving some problems on quantitative aptitude related to angles.
3. Data Presentation: Ordered presentation of data or frequency table.
4. Data Presentation – Pie Charts: Presenting information. Generating, presenting and using data for statistical purposes.
5. Probability: Review. Concept and meaning of probability. Occurrence of chance events in everyday life. Importance and usefulness of probability. Examples of chance events – ludo game, tossing of coins etc.
6. Probability of chance events. Determination of the probability of chance events. Experimenting, using coins and dice and calculating the probability of the results.
7. Review: Gradient of straight line graph. Distance and Time graph. Velocity-time graph. Representation of real-life situations on graph.
8. Revision on angles and polygons – definition, types of angles and polygons, sum of interior angles in polygons etc.
9. Revision of linear inequalities in one variable and graphs of linear equation in two variable.
10. Revision of linear inequalities in one variable and graphs of linear equation in two variable.
11. General Revision
3RD TERM
WEEK 1
LESSON 1
TOPIC: ANGLES
CONTENT: i. Sum of the angles of a convex polygon
Angles of elevation and depression
Using angles of elevation and depression in calculating measurements
Quantitative aptitude problems related to angles
]Topic 1: Sum of the angles of a convex polygon[/b]
A convex polygon has no angle pointing inwards. Each internal angle of a convex polygon is always less than 1800. A polygon is convex if any line segment joining any two points on it stays inside the polygon itself. Examples of convex polygons are shown below:
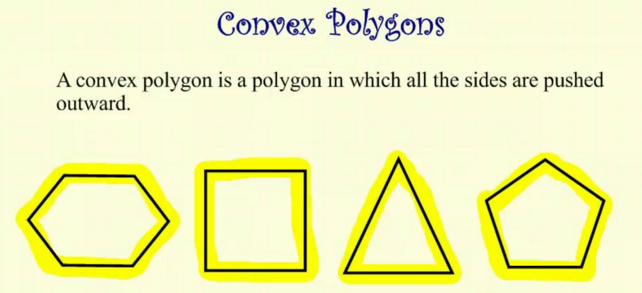
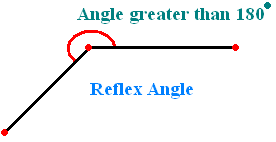
If there is any internal angle greater than 180°, the angle points inwards and the polygon becomes concave.
Sum of Interior angles
The sum of the interior angles of any convex n-gon (polygon with n sides) is given by:
Sum of interior angles = (n-2) x 1800
Or Sum of interior angles = (2n - 4) x 900
Or Sum of interior angles = (2n – 4) Right angles
Sum of Exterior angles
Sum of exterior angles = 3600
Each interior angle for a regular convex polygon
Each interior angle =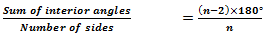 =((n-2)×180°)/n
Note: A regular polygon is a polygon having all sides equal and all angles equal.
https://youtu.be/DGKwdHMiqCg
EXAMPLE – 1: What is the sum of the interior angles of a pentagon?
Solution
A pentagon has five sides, that is, n = 5.
Therefore, sum of interior angles = (n - 2) x 1800
= (5 - 2) x 1800
= 3 x 1800 = 5400
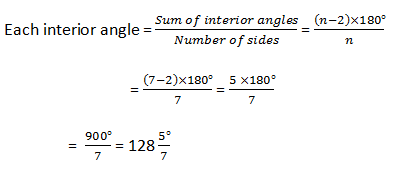
EXAMPLE – 2: Calculate the size of each interior angle of a regular heptagon.
Solution
A regular heptagon has 7 equal sides, that is, n = 7.
Each interior angle = (Sum of interior angles)/(Number of sides) = ((n-2)×180°)/n
= ((7-2)×180°)/7 = (5 ×180°)/7
= (900°)/7 = 128 (5°)/7
https://youtu.be/_n3KZR1DSEo
EXAMPLE – 3: The sum of the interior angles of a regular polygon is 10 right angles.
How many sides has the polygon?
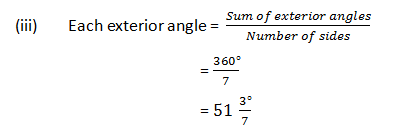
What is the sum of the exterior angles of the polygon?
Calculate the size of each exterior angle of the polygon.
Solution:
Sum of interior angles = (n - 2) ×180° = (n-2)×2 ×90°
Sum of interior angles= (2n-4) ×90°
Sum of interior angles = (2n - 4) right angles
2n – 4 = 10
2n = 10 + 4
2n = 14
Therefore, n = 7 sides
Sum of exterior angles = 360°
Each exterior angle = (Sum of exterior angles)/(Number of sides)
= (360°)/7
= 51 (3°)/7
https://youtu.be/BG1HpadfiKw
EVALUATION:
What is the sum of interior angles of a: (a) hexagon (b) nonagon
Calculate the size of each interior angle and each exterior angle in a regular: (a) octagon (b) decagon
The sum of six of the interior angles of a nonagon is 9200 . The other three angles are all equal. Find the size of each of the other three angles.
If the angles of a quadrilateral are x, 2x and 3x, what is the value of x? Calculate the size of the largest angle.
LESSON 2
Topic 2: Angles of elevation and depression
Angle of Elevation:
Angle of Elevation: the angle that an observer would raise his or her line of sight above a horizontal line in order to see an object. The angle of elevation is the angle between the horizontal and the observer's line of sight.
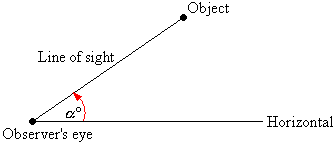
In the diagram above, the angle of elevation of the object from the observer is α0.
Angle of Depression
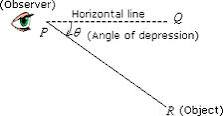
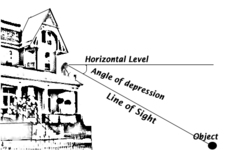
If the object is below the level of the observer, then the angle between the horizontal and the observer's line of sight is called the angle of depression. If an observer were UP ABOVE and needed to look down, the angle of depression would be the angle that the person would need to lower lower his or her line of sight.
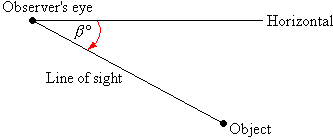
In the diagram above, the angle of depression of the object from the observer is β0.
In other words, as shown in the diagrams below, the angle formed with the horizontal when an observer looks up is called angle of elevation whereas, the angle formed with the horizontal when an observer looks down is called angle of depression.
There is a connection between angle of elevation and angle of depression. For example, the angle of elevation of Y from X is the same as the angle of depression of X from Y. Therefore angles of elevation and depression are alternate angles.
https://youtu.be/Pp6h4GMMXI4
EVALUATION:
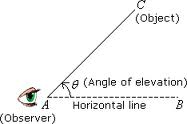
Make a sketch of the diagram below in your notebook.
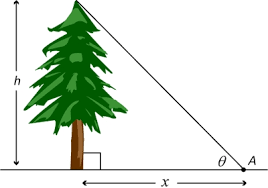
Using a protractor and ruler,
Find the angle of elevation (θ) of the top of the tree from the observer A
The distance between the tree and the observer
The height of the tree
Make a sketch of the following diagram in your notebook.
Then using a protractor and ruler:
Find the size of the angle of depression of the object from the observer.
LESSON 3
Topic 3: Using angles of elevation and depression in calculating measurements
Angles of elevation and depression can be measured with a simple instrument called a clinometer. A simple clinometer is made from a chalk-board protractor in which a plumb-line hangs from the center of the protractor.
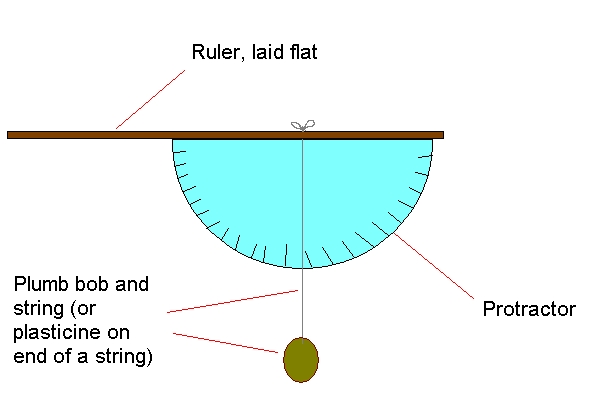
The angle that the plumb-line makes with the 900 vertical axes when the clinometer is placed in the observer’s direction is the angle of elevation / depression.

In the figure above, a plumb-line hangs from the center of the protractor at A. The observer sights an object along the line BAC. The angle of elevation e0 is the angle between AO and the plumb-line. The size of e0 can be read from the scale. Notice that e0 increases from 00 at O to 900 at B.
Method: Cut out the clinometer. Stick it on a thick cardboard. Tie a heavy mass to the center using a thread. Then find elevations by sighting objects through two points.
https://youtu.be/ZQDEU2R7aI4
EVALUATION:
Carry out the following activities using a tape and clinometer:
Stand at a point Y on level ground, where the top of the wall has an angle of elevation of 450
Find the distance from Y to the base of the wall. Record the height of the wall.
LESSON 4
Topic 4: Quantitative aptitude problems related to angles
EXAMPLE – 1: What is the angle between the minute-hand and hour-hand of a clock at 3 0’clock.
Solution:
Angle of rotation of the hour hand from 0hr to 12hr = 360°
From 0hr to 1hr = 360°/12 = 30°
Therefore from 0hr to 3hr = 30°×3=90°
https://youtu.be/LEHYr0XfSyI
EVALUATION:
Find the angle between the hands of a clock at 7 0’clock.
https://youtu.be/6Tt3zY3wWSY
ASSIGNMENT:
New General Mathematics for Junior Secondary Schools 2 by M.F. Macrae et. al. Exercise 6d Nos 3, 4, 5, 7, 8 Pages 57 – 58. Exercise 20d Nos 1-6, 9 Pages 199-200.
New General Mathematics for Junior Secondary Schools 2 by M.F. Macrae et. al. Chapter 6-4 Pages 55-58
TOPIC: ANGLES
CONTENT: i. Sum of the angles of a convex polygon
Angles of elevation and depression
Using angles of elevation and depression in calculating measurements
Quantitative aptitude problems related to angles
]Topic 1: Sum of the angles of a convex polygon[/b]
A convex polygon has no angle pointing inwards. Each internal angle of a convex polygon is always less than 1800. A polygon is convex if any line segment joining any two points on it stays inside the polygon itself. Examples of convex polygons are shown below:
If there is any internal angle greater than 180°, the angle points inwards and the polygon becomes concave.
Sum of Interior angles
The sum of the interior angles of any convex n-gon (polygon with n sides) is given by:
Sum of interior angles = (n-2) x 1800
Or Sum of interior angles = (2n - 4) x 900
Or Sum of interior angles = (2n – 4) Right angles
Sum of Exterior angles
Sum of exterior angles = 3600
Each interior angle for a regular convex polygon
Each interior angle =
=((n-2)×180°)/nNote: A regular polygon is a polygon having all sides equal and all angles equal.
https://youtu.be/DGKwdHMiqCg
EXAMPLE – 1: What is the sum of the interior angles of a pentagon?
Solution
A pentagon has five sides, that is, n = 5.
Therefore, sum of interior angles = (n - 2) x 1800
= (5 - 2) x 1800
= 3 x 1800 = 5400
EXAMPLE – 2: Calculate the size of each interior angle of a regular heptagon.
Solution
A regular heptagon has 7 equal sides, that is, n = 7.
Each interior angle = (Sum of interior angles)/(Number of sides) = ((n-2)×180°)/n
= ((7-2)×180°)/7 = (5 ×180°)/7
= (900°)/7 = 128 (5°)/7
https://youtu.be/_n3KZR1DSEo
EXAMPLE – 3: The sum of the interior angles of a regular polygon is 10 right angles.
How many sides has the polygon?
What is the sum of the exterior angles of the polygon?
Calculate the size of each exterior angle of the polygon.
Solution:
Sum of interior angles = (n - 2) ×180° = (n-2)×2 ×90°
Sum of interior angles= (2n-4) ×90°
Sum of interior angles = (2n - 4) right angles
2n – 4 = 10
2n = 10 + 4
2n = 14
Therefore, n = 7 sides
Sum of exterior angles = 360°
Each exterior angle = (Sum of exterior angles)/(Number of sides)
= (360°)/7
= 51 (3°)/7
https://youtu.be/BG1HpadfiKw
EVALUATION:
What is the sum of interior angles of a: (a) hexagon (b) nonagon
Calculate the size of each interior angle and each exterior angle in a regular: (a) octagon (b) decagon
The sum of six of the interior angles of a nonagon is 9200 . The other three angles are all equal. Find the size of each of the other three angles.
If the angles of a quadrilateral are x, 2x and 3x, what is the value of x? Calculate the size of the largest angle.
LESSON 2
Topic 2: Angles of elevation and depression
Angle of Elevation:
Angle of Elevation: the angle that an observer would raise his or her line of sight above a horizontal line in order to see an object. The angle of elevation is the angle between the horizontal and the observer's line of sight.
In the diagram above, the angle of elevation of the object from the observer is α0.
Angle of Depression
If the object is below the level of the observer, then the angle between the horizontal and the observer's line of sight is called the angle of depression. If an observer were UP ABOVE and needed to look down, the angle of depression would be the angle that the person would need to lower lower his or her line of sight.
In the diagram above, the angle of depression of the object from the observer is β0.
In other words, as shown in the diagrams below, the angle formed with the horizontal when an observer looks up is called angle of elevation whereas, the angle formed with the horizontal when an observer looks down is called angle of depression.
There is a connection between angle of elevation and angle of depression. For example, the angle of elevation of Y from X is the same as the angle of depression of X from Y. Therefore angles of elevation and depression are alternate angles.
https://youtu.be/Pp6h4GMMXI4
EVALUATION:
Make a sketch of the diagram below in your notebook.
Using a protractor and ruler,
Find the angle of elevation (θ) of the top of the tree from the observer A
The distance between the tree and the observer
The height of the tree
Make a sketch of the following diagram in your notebook.
Then using a protractor and ruler:
Find the size of the angle of depression of the object from the observer.
LESSON 3
Topic 3: Using angles of elevation and depression in calculating measurements
Angles of elevation and depression can be measured with a simple instrument called a clinometer. A simple clinometer is made from a chalk-board protractor in which a plumb-line hangs from the center of the protractor.
The angle that the plumb-line makes with the 900 vertical axes when the clinometer is placed in the observer’s direction is the angle of elevation / depression.
In the figure above, a plumb-line hangs from the center of the protractor at A. The observer sights an object along the line BAC. The angle of elevation e0 is the angle between AO and the plumb-line. The size of e0 can be read from the scale. Notice that e0 increases from 00 at O to 900 at B.
Method: Cut out the clinometer. Stick it on a thick cardboard. Tie a heavy mass to the center using a thread. Then find elevations by sighting objects through two points.
https://youtu.be/ZQDEU2R7aI4
EVALUATION:
Carry out the following activities using a tape and clinometer:
Stand at a point Y on level ground, where the top of the wall has an angle of elevation of 450
Find the distance from Y to the base of the wall. Record the height of the wall.
LESSON 4
Topic 4: Quantitative aptitude problems related to angles
EXAMPLE – 1: What is the angle between the minute-hand and hour-hand of a clock at 3 0’clock.
Solution:
Angle of rotation of the hour hand from 0hr to 12hr = 360°
From 0hr to 1hr = 360°/12 = 30°
Therefore from 0hr to 3hr = 30°×3=90°
https://youtu.be/LEHYr0XfSyI
EVALUATION:
Find the angle between the hands of a clock at 7 0’clock.
https://youtu.be/6Tt3zY3wWSY
ASSIGNMENT:
New General Mathematics for Junior Secondary Schools 2 by M.F. Macrae et. al. Exercise 6d Nos 3, 4, 5, 7, 8 Pages 57 – 58. Exercise 20d Nos 1-6, 9 Pages 199-200.
New General Mathematics for Junior Secondary Schools 2 by M.F. Macrae et. al. Chapter 6-4 Pages 55-58
WEEK 2
LESSON 5
TOPIC: Data Presentation: Ordered presentation of data or frequency table.
CONTENT:
i. Data and Types of Data
ii. Ordered Presentation of Data
iii. Frequency and Frequency Table
iv. Class Interval (Groups)
Topic 1: Data and Types of Data
The word data means information, which are usually given in the form of numbers or facts. Data may be categorized into
a) Qualitative / categorical data. They are non numerical and are described only in words. Examples are names, places, color, taste, opinions, brightness and so on.
b) Quantitative data: They are numerical data which are usually given in form of a number or measurement. Examples are number of cars, height of people, number of schools, number of admissions, etc. Quantitative data can be further classified into:
i) Discrete data: They are obtained usually by counting and not by measurements. Most often they are whole numbers and not fractions / decimal numbers. The sense is that we can only say we have 6 houses and not 6 ½ houses; we have 4 boys and not 4 3/4 boys. Thus, discrete data have certain definite or exact values.
ii) Continuous data: They are data which are obtained by measurements. They can take any values within a given range, including fractions and decimals. Continuous data concerns more with precision of figures or numbers’ measurements, perhaps using instrument. Examples of continuous data are heights, distances, temperature, areas, perimeters, volumes, density, mass, angles, etc. This is so because these may not be whole numbers in most practical situations.
https://youtu.be/7bsNWq2A5gI
EVALUATION:
What is Data
Mention the various categories of Data
LESSON 6
Topic 2: Ordered Presentation of Data
Ordered Presentation of data is the arrangement of data in a way that will make them look organized and more presentable. Ordered presentation of data also makes statistical data easy to read, understand and interpret. Data containing numbers can be presented in an ordered format through:
i. Sorting
ii. Use of frequency table
Data can also be presented using graphs.
Sorting
This involves arranging data either from the least to the highest (increasing or rank order) and vice versa. When data are not sorted out and not arranged to taste, we say they are still in the raw state and are therefore called as raw data.
Data sorted out in increasing order are said to be given in Rank Order. In a Rank Order, the Range of the set of data can be calculated.
https://youtu.be/0ZKtsUkrgFQ
Range --- The range of any set of data is the difference between the largest value and smallest value. For instance, given the set of numbers:
5, 8, 3, 2, 17, 9, 13, 6, 4
Range = 17 – 2 = 15
Sometimes the range is written as 2 → 17, meaning that the data ranges from 2 to 17.
Example:
Question: The raw scores of 20 pupils in a Mathematics test are:
6, 8, 10, 5, 2, 10, 6, 9, 4, 3, 10, 5, 6, 9, 8, 7, 7, 6, 6, 3
(a) Arrange the scores in the order of magnitude starting with the smallest.
(b) Arrange the scores in the order of magnitude starting with the largest.
(c) What is the difference between the least and the highest scores?
(d) How many pupils scored less than 6?
(e) How many pupils have the lowest score; and how many have the highest score?
(f) If the pass mark is 7 how many failed and how many passed?
Solution:
2, 3, 3, 4, 5, 5, 6, 6, 6, 6, 6, 7, 7, 8, 8, 9, 9, 10, 10, 10
10, 10, 10, 9, 9, 8, 8, 7, 7, 6, 6, 6, 6, 6, 5, 5, 4, 3, 2, 2
Range = Highest score – Lowest Score
= 10 – 2
= 8
Less than 6 = Numbers from 2 to 5
2, 3, 3, 4, 5, 5
Therefore 6 pupils scored less than 6 marks
Lowest score = 2, Therefore 1 pupil has the lowest score
Highest score = 10, Therefore 3 pupils have the highest score
Pass mark = 7 or more,
Pass scores = 7, 7, 8, 8, 9, 9, 10, 10, 10. Therefore 9 pupils passed
Fail mark = Less than 7
Fail scores = 2, 3, 3, 4, 5, 5, 6, 6, 6, 6, 6. Therefore 11 pupils failed
https://youtu.be/estOLtAfUQ8
EVALUATION:
Question: The raw scores of 20 pupils in a Basic Science test are:
16, 8, 10, 5, 4, 20, 16, 9, 14, 13, 10, 5, 6, 19, 28, 12, 17, 22, 11, 13
(a) Arrange the scores in the order of magnitude starting with the smallest.
(b) Arrange the scores in the order of magnitude starting with the largest.
(c) What is the difference between the least and the highest scores?
(d) How many pupils scored less than 20?
(e) How many pupils have the lowest score; and how many have the highest score?
(f) If the pass mark is 15 how many failed and how many passed?
LESSON 7
Topic 3: Frequency and Frequency Tables:
The frequency of a particular data value is the number of times the data value occurs. For example, if four students have a score of 80 in mathematics, and then the score of 80 is said to have a frequency of 4.
The frequency of a data value is often represented by f.
A frequency table is constructed by arranging collected data values in ascending order of magnitude with their corresponding frequencies. This table shows the arrangement of data in at least two columns, where the first column indicates the items from the least to the highest and the second column indicates the frequencies. There can also be the third column for tally.
In general:
We use the following steps to construct a frequency table:
Step 1:
Construct a table with three columns. Then in the first column, write down all of the data values in ascending order of magnitude.
Step 2:
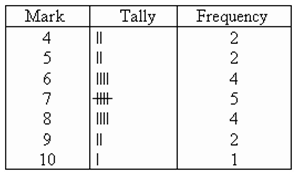
To complete the second column, go through the list of data values and place one tally mark at the appropriate place in the second column for every data value. When the fifth tally is reached for a mark, draw a horizontal line through the first four tally marks as shown for 7 in the above frequency table. We continue this process until all data values in the list are tallied.
Step 3:
Count the number of tally marks for each data value and write it in the third column.
For example, the 20 raw scores of students given below can be re-organized in a frequency- table:
2, 3, 3, 4, 5, 5, 6, 6, 6, 6, 6, 7, 7, 8, 8, 9, 9, 10, 10, 10
There may also be the third column for tally.
https://youtu.be/pNbqL-ysliI
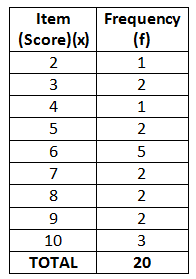
EXAMPLE - 1
The marks awarded for an assignment set for a Year 8 class of 20 students were as follows:
6 7 5 7 7 8 7 6 9 7 4 10 6 8 8 9 5 6 4 8
Present this information in a frequency table.
Solution:
To construct a frequency table, we proceed as follows:
Construct a table with three columns. The first column shows what is being arranged in ascending order (i.e. the marks). The lowest mark is 4. So, start from 4 in the first column as shown below.
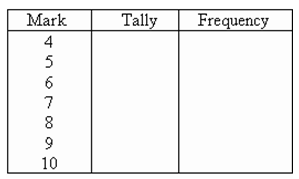
Count the number of tally marks for each mark and write it in third column. The finished frequency table is as follows:
EVALUATION:
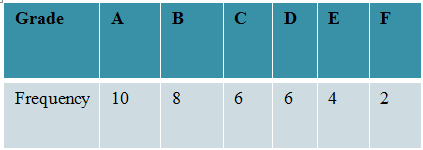
Use the frequency table to represent the table below:
Grade A B C D E F
Frequency 10 8 6 6 4 2
LESSON 8
Topic 4: Class Intervals (or Groups)
The frequency of a class interval (or group) is the number of data values that fall in the range specified by that group (or class interval). When the set of data values are spread out, it is difficult to set up a frequency table for every data value as there will be too many rows in the table. So the data are grouped into class intervals (or groups) to help us organize, interpret and analyze the data.
Ideally, there should be between five and ten rows in a frequency table. Bear this in mind when deciding the size of the class interval (or group).
Each group starts at a data value that is a multiple of that group. For example, if the size of the group is 5, then the groups should start at 5, 10, 15, 20 etc. Likewise, if the size of the group is 10, then the groups should start at 10, 20, 30, 40 etc.
https://youtu.be/L31ccw-yefc
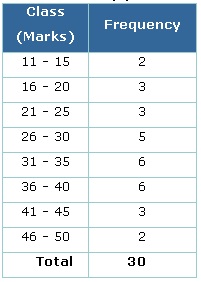
EXAMPLE:
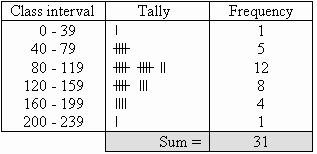
The number of calls from motorists per day was recorded for the month of December 2003. The results were as follows:
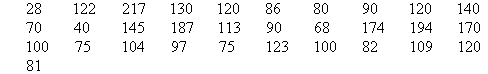
Set up a frequency table for this set of data values using class interval of 40.
Solution:
Construct a table with three columns, and then write the data groups or class intervals in the first column. The size of each group is 40. So, the groups will start at 0, 40, 80, 120, 160 and 200 to include all of the data.
EVALUATION:
The data below represent the daily units of electricity used by a certain household in September. Represent the information by a frequency table.
25, 14, 17, 12, 8, 17, 13, 17, 4, 25, 2, 8, 15, 4, 7, 14, 18, 7, 6, 5, 28, 32, 30, 19, 11, 14, 22, 4, 11, 9.
ASSIGNMENT:
New General Mathematics for Junior Secondary Schools 2 by M.F. Macrae et. al. Review Test 8 No 1 Pages 11-12.
New General Mathematics for Junior Secondary Schools 2 by M.F. Macrae et. al. Review of previous coursework Pages 10-12.
Further Studies
Study More...
TOPIC: Data Presentation: Ordered presentation of data or frequency table.
CONTENT:
i. Data and Types of Data
ii. Ordered Presentation of Data
iii. Frequency and Frequency Table
iv. Class Interval (Groups)
Topic 1: Data and Types of Data
The word data means information, which are usually given in the form of numbers or facts. Data may be categorized into
a) Qualitative / categorical data. They are non numerical and are described only in words. Examples are names, places, color, taste, opinions, brightness and so on.
b) Quantitative data: They are numerical data which are usually given in form of a number or measurement. Examples are number of cars, height of people, number of schools, number of admissions, etc. Quantitative data can be further classified into:
i) Discrete data: They are obtained usually by counting and not by measurements. Most often they are whole numbers and not fractions / decimal numbers. The sense is that we can only say we have 6 houses and not 6 ½ houses; we have 4 boys and not 4 3/4 boys. Thus, discrete data have certain definite or exact values.
ii) Continuous data: They are data which are obtained by measurements. They can take any values within a given range, including fractions and decimals. Continuous data concerns more with precision of figures or numbers’ measurements, perhaps using instrument. Examples of continuous data are heights, distances, temperature, areas, perimeters, volumes, density, mass, angles, etc. This is so because these may not be whole numbers in most practical situations.
https://youtu.be/7bsNWq2A5gI
EVALUATION:
What is Data
Mention the various categories of Data
LESSON 6
Topic 2: Ordered Presentation of Data
Ordered Presentation of data is the arrangement of data in a way that will make them look organized and more presentable. Ordered presentation of data also makes statistical data easy to read, understand and interpret. Data containing numbers can be presented in an ordered format through:
i. Sorting
ii. Use of frequency table
Data can also be presented using graphs.
Sorting
This involves arranging data either from the least to the highest (increasing or rank order) and vice versa. When data are not sorted out and not arranged to taste, we say they are still in the raw state and are therefore called as raw data.
Data sorted out in increasing order are said to be given in Rank Order. In a Rank Order, the Range of the set of data can be calculated.
https://youtu.be/0ZKtsUkrgFQ
Range --- The range of any set of data is the difference between the largest value and smallest value. For instance, given the set of numbers:
5, 8, 3, 2, 17, 9, 13, 6, 4
Range = 17 – 2 = 15
Sometimes the range is written as 2 → 17, meaning that the data ranges from 2 to 17.
Example:
Question: The raw scores of 20 pupils in a Mathematics test are:
6, 8, 10, 5, 2, 10, 6, 9, 4, 3, 10, 5, 6, 9, 8, 7, 7, 6, 6, 3
(a) Arrange the scores in the order of magnitude starting with the smallest.
(b) Arrange the scores in the order of magnitude starting with the largest.
(c) What is the difference between the least and the highest scores?
(d) How many pupils scored less than 6?
(e) How many pupils have the lowest score; and how many have the highest score?
(f) If the pass mark is 7 how many failed and how many passed?
Solution:
2, 3, 3, 4, 5, 5, 6, 6, 6, 6, 6, 7, 7, 8, 8, 9, 9, 10, 10, 10
10, 10, 10, 9, 9, 8, 8, 7, 7, 6, 6, 6, 6, 6, 5, 5, 4, 3, 2, 2
Range = Highest score – Lowest Score
= 10 – 2
= 8
Less than 6 = Numbers from 2 to 5
2, 3, 3, 4, 5, 5
Therefore 6 pupils scored less than 6 marks
Lowest score = 2, Therefore 1 pupil has the lowest score
Highest score = 10, Therefore 3 pupils have the highest score
Pass mark = 7 or more,
Pass scores = 7, 7, 8, 8, 9, 9, 10, 10, 10. Therefore 9 pupils passed
Fail mark = Less than 7
Fail scores = 2, 3, 3, 4, 5, 5, 6, 6, 6, 6, 6. Therefore 11 pupils failed
https://youtu.be/estOLtAfUQ8
EVALUATION:
Question: The raw scores of 20 pupils in a Basic Science test are:
16, 8, 10, 5, 4, 20, 16, 9, 14, 13, 10, 5, 6, 19, 28, 12, 17, 22, 11, 13
(a) Arrange the scores in the order of magnitude starting with the smallest.
(b) Arrange the scores in the order of magnitude starting with the largest.
(c) What is the difference between the least and the highest scores?
(d) How many pupils scored less than 20?
(e) How many pupils have the lowest score; and how many have the highest score?
(f) If the pass mark is 15 how many failed and how many passed?
LESSON 7
Topic 3: Frequency and Frequency Tables:
The frequency of a particular data value is the number of times the data value occurs. For example, if four students have a score of 80 in mathematics, and then the score of 80 is said to have a frequency of 4.
The frequency of a data value is often represented by f.
A frequency table is constructed by arranging collected data values in ascending order of magnitude with their corresponding frequencies. This table shows the arrangement of data in at least two columns, where the first column indicates the items from the least to the highest and the second column indicates the frequencies. There can also be the third column for tally.
In general:
We use the following steps to construct a frequency table:
Step 1:
Construct a table with three columns. Then in the first column, write down all of the data values in ascending order of magnitude.
Step 2:
To complete the second column, go through the list of data values and place one tally mark at the appropriate place in the second column for every data value. When the fifth tally is reached for a mark, draw a horizontal line through the first four tally marks as shown for 7 in the above frequency table. We continue this process until all data values in the list are tallied.
Step 3:
Count the number of tally marks for each data value and write it in the third column.
For example, the 20 raw scores of students given below can be re-organized in a frequency- table:
2, 3, 3, 4, 5, 5, 6, 6, 6, 6, 6, 7, 7, 8, 8, 9, 9, 10, 10, 10
There may also be the third column for tally.
https://youtu.be/pNbqL-ysliI
EXAMPLE - 1
The marks awarded for an assignment set for a Year 8 class of 20 students were as follows:
6 7 5 7 7 8 7 6 9 7 4 10 6 8 8 9 5 6 4 8
Present this information in a frequency table.
Solution:
To construct a frequency table, we proceed as follows:
Construct a table with three columns. The first column shows what is being arranged in ascending order (i.e. the marks). The lowest mark is 4. So, start from 4 in the first column as shown below.
Count the number of tally marks for each mark and write it in third column. The finished frequency table is as follows:
EVALUATION:
Use the frequency table to represent the table below:
Grade A B C D E F
Frequency 10 8 6 6 4 2
LESSON 8
Topic 4: Class Intervals (or Groups)
The frequency of a class interval (or group) is the number of data values that fall in the range specified by that group (or class interval). When the set of data values are spread out, it is difficult to set up a frequency table for every data value as there will be too many rows in the table. So the data are grouped into class intervals (or groups) to help us organize, interpret and analyze the data.
Ideally, there should be between five and ten rows in a frequency table. Bear this in mind when deciding the size of the class interval (or group).
Each group starts at a data value that is a multiple of that group. For example, if the size of the group is 5, then the groups should start at 5, 10, 15, 20 etc. Likewise, if the size of the group is 10, then the groups should start at 10, 20, 30, 40 etc.
https://youtu.be/L31ccw-yefc
EXAMPLE:
The number of calls from motorists per day was recorded for the month of December 2003. The results were as follows:
Set up a frequency table for this set of data values using class interval of 40.
Solution:
Construct a table with three columns, and then write the data groups or class intervals in the first column. The size of each group is 40. So, the groups will start at 0, 40, 80, 120, 160 and 200 to include all of the data.
EVALUATION:
The data below represent the daily units of electricity used by a certain household in September. Represent the information by a frequency table.
25, 14, 17, 12, 8, 17, 13, 17, 4, 25, 2, 8, 15, 4, 7, 14, 18, 7, 6, 5, 28, 32, 30, 19, 11, 14, 22, 4, 11, 9.
ASSIGNMENT:
New General Mathematics for Junior Secondary Schools 2 by M.F. Macrae et. al. Review Test 8 No 1 Pages 11-12.
New General Mathematics for Junior Secondary Schools 2 by M.F. Macrae et. al. Review of previous coursework Pages 10-12.
Further Studies
Study More...
WEEK 3
LESSON 9
TOPIC: PIE CHART
CONTENT:
i. Meaning of Pie Chart
ii. How to draw a Pie Chart
iii. Worked examples on Pie Charts
iv. Further examples on Pie Charts
Topic 1: Meaning of Pie Chart:
A pie chart is made up of a circle used to represent the frequency of each item in form of angle. To draw the pie chart, convert the frequencies to angles. A pie chart is a circular chart in which the circle is divided into sectors. Each sector visually represents an item in a data set to match the amount of the item as a fraction of the total data set. In a pie chart, the arc length of each sector is proportional to the frequency it represents. It is named for its resemblance to a pie which has been sliced.
The pie chart is perhaps the most widely used statistical chart in the business world and the mass media. A Pie chart is useful to compare different parts of a whole amount. It is often used to present financial information. E.g. A company's expenditure can be shown to be the sum of its parts including different expense categories such as salaries, borrowing interest, taxation and general running costs (i.e. rent, electricity, heating etc).
https://youtu.be/cC0fZ_lkFpQ
EVALUATION:
In your words, briefly explain what is meant by: “Pie Chart”
LESSON 10
Sub-Topic 2: How to Draw a Pie Chart
A pie chart is drawn with the help of a table which transforms the data into fractions of the total and angles. The angles are obtained by multiplying each fraction by 3600.
The table normally contains 4 columns.
In the first column, the event for each category of data is indicated. In the second column, the frequency or value of each event is indicated. In the third column, the frequencies are converted to fractions of the total frequency. In the fourth column, the fractions are converted to angles.
Check your calculations by totaling the angles listed in the fourth column. The sum of angles should be equals to 3600.
Then draw a circle and divide the circle into sectors, each sector representing each of the angles obtained.
Title your chart and indicate the legend (or keys) of your chart.
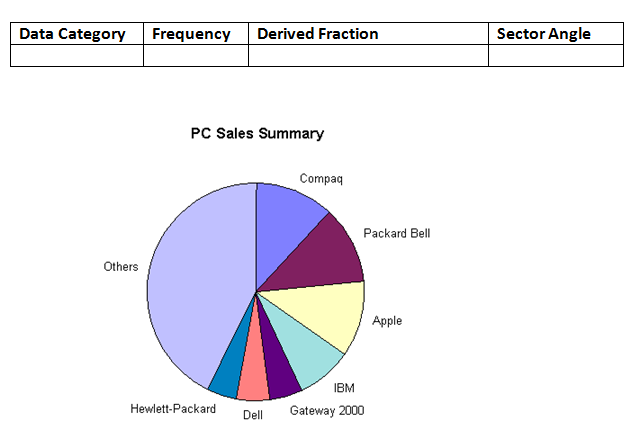
The Table
Data Category Frequency Derived Fraction Sector Angle
A pie-chart
https://youtu.be/p_nPxTRuLxo
EVALUATION:
Draw a circle and divide the circle into various sectors using your protractor and ruler. Use your discretion to do this. Obtain the angle represented by each sector.
LESSON 11
Sub-Topic 3: WORKED EXAMPLE ON PIE CHART
Example
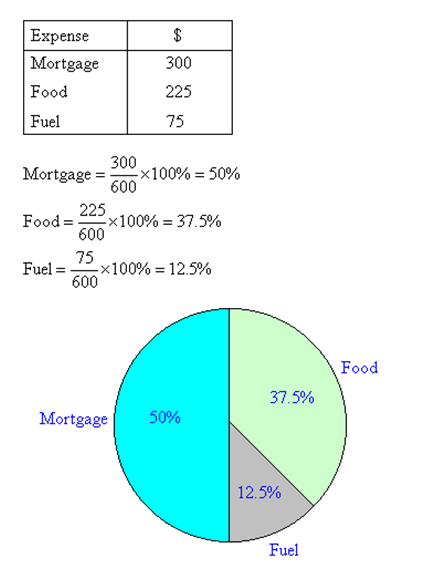
A family's weekly expenditure on its house mortgage, food and fuel is as follows:
Note:
It is simple to read a pie chart. Just look at the required sector representing an item (or category) and read off the value. For example, the weekly expenditure of the family on food is 37.5% of the total expenditure measured.
A pie chart is used to compare the different parts that make up a whole amount.
https://youtu.be/SuRFN7n_ZlA
EVALUATION:
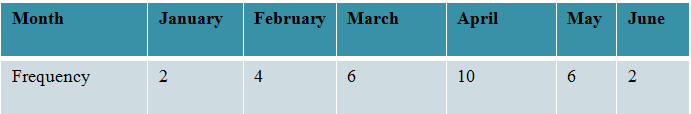
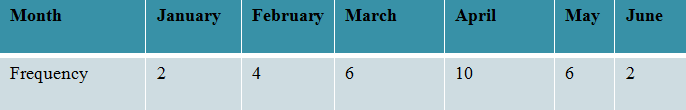
Given the data below, which show the number of mechanical faults of a machine within the first six months of a particular year. Draw the pie-chart diagram to represent the information.
Month January February March April May June
Frequency 2 4 6 10 6 2
LESSON 12
Topic 4: Further Examples on Pie Charts
Example 2
The following chart is based on results of the election for the European Parliament in 2004. The table lists the number of seats allocated to each party, along with the derived fraction of the total that they each make up. The value in the last column, the derived angle of each sector, is found by multiplying the derived fraction by 360°.
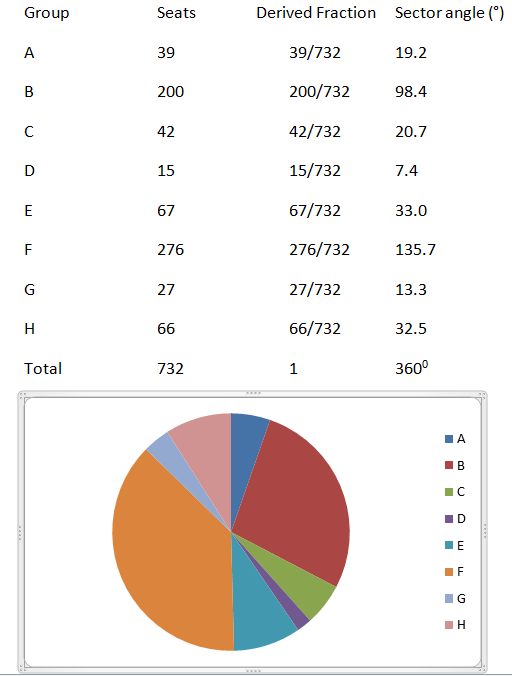
These totals do not add up to 1 and 3600 but can be rounded off.
The size of each sector angle is proportional to the size of the corresponding quantity, here the number of seats. For example, the sector angle for the largest group (European People's Party (EPP)) is 135.7° because 0.377 times 360, rounded to one decimal place equals 135.7.
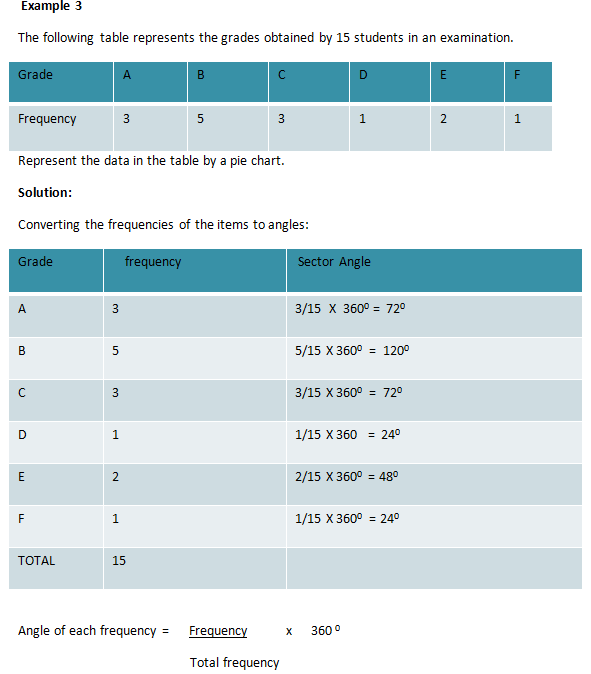
Example 3
The following table represents the grades obtained by 15 students in an examination.
Grade A B C D E F
Frequency 3 5 3 1 2 1
Represent the data in the table by a pie chart.
Solution:
Converting the frequencies of the items to angles:
Grade frequency Sector Angle
A 3 3/15 X 3600 = 720
B 5 5/15 X 3600 = 1200
C 3 3/15 X 3600 = 720
D 1 1/15 X 360 = 240
E 2 2/15 X 3600 = 480
F 1 1/15 X 3600 = 240
TOTAL 15
Angle of each frequency = Frequency x 3600
Total frequency
The angles for the items (grades) are then represented in a circle as follows:
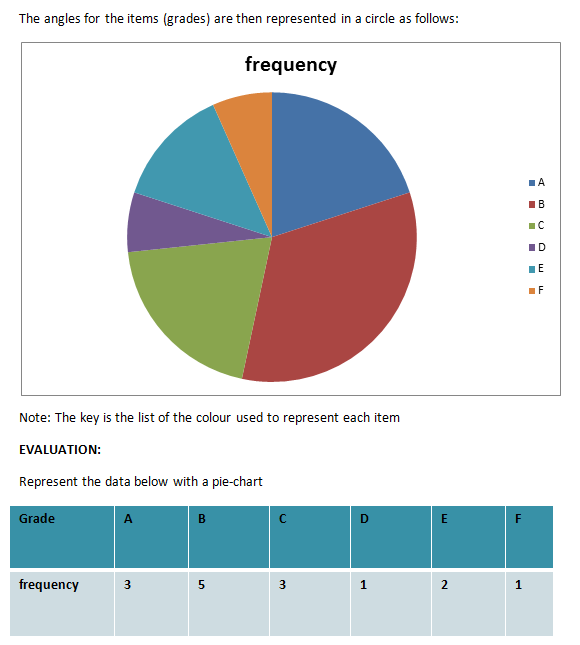
Note: The key is the list of the colour used to represent each item
https://youtu.be/coTDCzpjiWU
EVALUATION:
Represent the data below with a pie-chart
Grade A B C D E F
frequency 3 5 3 1 2 1
ASSIGNMENT:
New General Mathematics for Junior Secondary Schools 2 by M.F. Macrae et. al. Review of previous coursework Pages 10-12.
New General Mathematics for Junior Secondary Schools 2 by M.F. Macrae et. al. Review of previous coursework Pages 10-12.
TOPIC: PIE CHART
CONTENT:
i. Meaning of Pie Chart
ii. How to draw a Pie Chart
iii. Worked examples on Pie Charts
iv. Further examples on Pie Charts
Topic 1: Meaning of Pie Chart:
A pie chart is made up of a circle used to represent the frequency of each item in form of angle. To draw the pie chart, convert the frequencies to angles. A pie chart is a circular chart in which the circle is divided into sectors. Each sector visually represents an item in a data set to match the amount of the item as a fraction of the total data set. In a pie chart, the arc length of each sector is proportional to the frequency it represents. It is named for its resemblance to a pie which has been sliced.
The pie chart is perhaps the most widely used statistical chart in the business world and the mass media. A Pie chart is useful to compare different parts of a whole amount. It is often used to present financial information. E.g. A company's expenditure can be shown to be the sum of its parts including different expense categories such as salaries, borrowing interest, taxation and general running costs (i.e. rent, electricity, heating etc).
https://youtu.be/cC0fZ_lkFpQ
EVALUATION:
In your words, briefly explain what is meant by: “Pie Chart”
LESSON 10
Sub-Topic 2: How to Draw a Pie Chart
A pie chart is drawn with the help of a table which transforms the data into fractions of the total and angles. The angles are obtained by multiplying each fraction by 3600.
The table normally contains 4 columns.
In the first column, the event for each category of data is indicated. In the second column, the frequency or value of each event is indicated. In the third column, the frequencies are converted to fractions of the total frequency. In the fourth column, the fractions are converted to angles.
Check your calculations by totaling the angles listed in the fourth column. The sum of angles should be equals to 3600.
Then draw a circle and divide the circle into sectors, each sector representing each of the angles obtained.
Title your chart and indicate the legend (or keys) of your chart.
The Table
Data Category Frequency Derived Fraction Sector Angle
A pie-chart
https://youtu.be/p_nPxTRuLxo
EVALUATION:
Draw a circle and divide the circle into various sectors using your protractor and ruler. Use your discretion to do this. Obtain the angle represented by each sector.
LESSON 11
Sub-Topic 3: WORKED EXAMPLE ON PIE CHART
Example
A family's weekly expenditure on its house mortgage, food and fuel is as follows:
Note:
It is simple to read a pie chart. Just look at the required sector representing an item (or category) and read off the value. For example, the weekly expenditure of the family on food is 37.5% of the total expenditure measured.
A pie chart is used to compare the different parts that make up a whole amount.
https://youtu.be/SuRFN7n_ZlA
EVALUATION:
Given the data below, which show the number of mechanical faults of a machine within the first six months of a particular year. Draw the pie-chart diagram to represent the information.
Month January February March April May June
Frequency 2 4 6 10 6 2
LESSON 12
Topic 4: Further Examples on Pie Charts
Example 2
The following chart is based on results of the election for the European Parliament in 2004. The table lists the number of seats allocated to each party, along with the derived fraction of the total that they each make up. The value in the last column, the derived angle of each sector, is found by multiplying the derived fraction by 360°.
These totals do not add up to 1 and 3600 but can be rounded off.
The size of each sector angle is proportional to the size of the corresponding quantity, here the number of seats. For example, the sector angle for the largest group (European People's Party (EPP)) is 135.7° because 0.377 times 360, rounded to one decimal place equals 135.7.
Example 3
The following table represents the grades obtained by 15 students in an examination.
Grade A B C D E F
Frequency 3 5 3 1 2 1
Represent the data in the table by a pie chart.
Solution:
Converting the frequencies of the items to angles:
Grade frequency Sector Angle
A 3 3/15 X 3600 = 720
B 5 5/15 X 3600 = 1200
C 3 3/15 X 3600 = 720
D 1 1/15 X 360 = 240
E 2 2/15 X 3600 = 480
F 1 1/15 X 3600 = 240
TOTAL 15
Angle of each frequency = Frequency x 3600
Total frequency
The angles for the items (grades) are then represented in a circle as follows:
Note: The key is the list of the colour used to represent each item
https://youtu.be/coTDCzpjiWU
EVALUATION:
Represent the data below with a pie-chart
Grade A B C D E F
frequency 3 5 3 1 2 1
ASSIGNMENT:
New General Mathematics for Junior Secondary Schools 2 by M.F. Macrae et. al. Review of previous coursework Pages 10-12.
New General Mathematics for Junior Secondary Schools 2 by M.F. Macrae et. al. Review of previous coursework Pages 10-12.
WEEK 4
LESSON 13
TOPIC: Probability: Review
CONTENT:
i. Concept and meaning of probability
ii. Occurrence of chance events in everyday life
iii. Importance and usefulness of probability
iv Examples of chance events – ludo game, tossing of coins etc
CONTENT:
i. Concept and meaning of Probability
Probability is a measure of the likelihood of a required outcome happening. The required outcomes are the required possibilities in an occurrence or happening.
In form of a fraction, Probability = (number of required outcomes)/(number of possible/total outcomes)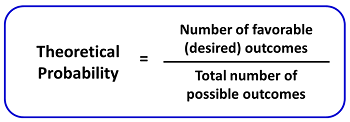
In other words, the likelihood of an event happening is called probability. Probability is 1 if it is certain that something will happen. Probability is 0 if it is certain that something cannot happen.
Probability is ordinarily used to describe an attitude of mind towards some proposition of whose truth we are not certain. The proposition of interest is usually of the form "Will a specific event occur?" The attitude of mind is of the form "How certain are we that the event will occur?" The certainty we adopt can be described in terms of a numerical measure and this number, between 0 and 1, is called probability. The higher the probability of an event, the more certain we are that the event will occur. Thus, probability in an applied sense is a measure of the likeliness that a (random) event will occur.
If the probability of something happening is x, then the probability of it not happening is 1 – x.
https://youtu.be/KzfWUEJjG18
EVALUATION:
What does probability mean to you? Briefly describe the term “probability”.
LESSON 14
Topic 2: Occurrence of chance events in everyday life
There are lots of these simple examples that we could be used to discuss probability. But chance events occur more often in everyday life. As you grow up you need to think about your actions and what the consequences of these actions will be. It's important to know how to use probability when you make decisions about your future.
There are many advertisements on TV for trading stocks which involve buying and selling shares from companies. Before buying a stock, there is need to investigate the company. If the company makes a lot of money with their product and if you own some of their stock, you may make more money, potentially more money than what you could earn at the bank as interest on your savings account. But if the company loses money, you may lose. People who work with company finances calculate the probability that a company should make money and is a good company to invest money in.
Another area of your life where probability is important is your health. For example, if you know that people in your family have heart disease and you develop high blood pressure when you are an adult then you know that you have a high probability of also having heart disease. You could be frightened by this high probability or you could live a healthier lifestyle that lowers your blood pressure and in turn lowers the probability of getting heart disease. In this case, you are using your understanding of probability to improve your health.
EXAMPLE – 1: Out of 200 buses, 40 were not involved in any accident in January. What is the probability that a bus will not be involved in accident in January?
Solution:
Required outcomes = Numbers of buses not involved in accident in January = 40
Possible outcomes = Number of buses altogether = 200
Probability of a bus not involved in accident in January = 40/200 = 1/5
EXAMPLE – 2: In a basket, there are two blue balls, three red balls and four green balls. What is the probability that a ball picked at random is:
Blue
Red
Green
Not Blue
Solution:
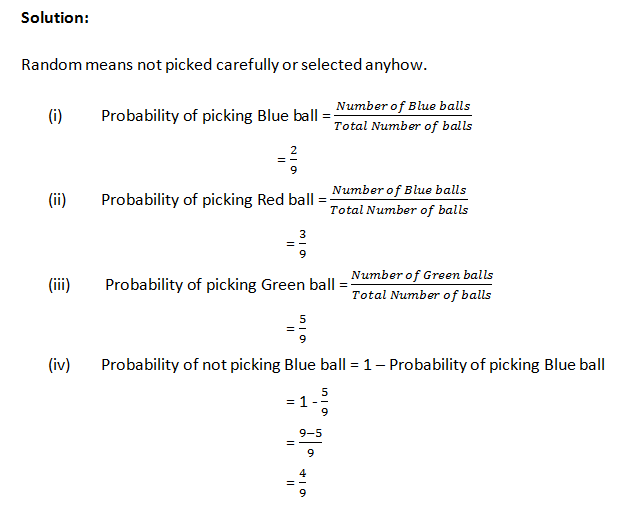
Random means not picked carefully or selected anyhow.
Probability of picking Blue ball = (Number of Blue balls)/(Total Number of balls)
= 2/9
Probability of picking Red ball = (Number of Blue balls)/(Total Number of balls)
= 3/9
Probability of picking Green ball = (Number of Green balls)/(Total Number of balls)
= 5/9
Probability of not picking Blue ball = 1 – Probability of picking Blue ball
= 1 - 5/9
= (9-5)/9
= 4/9
EXAMPLE – 3: A bucket contains 7 big mangoes and 21 small mangoes. What is the probability that a mango selected at random is:
Big
Small
Either
Neither
Solution:
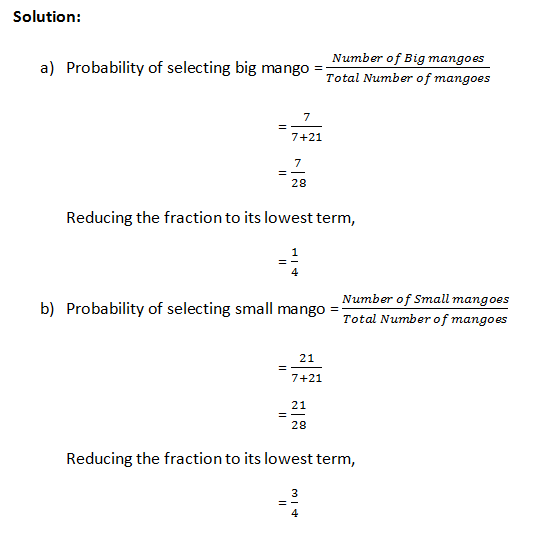
a) Probability of selecting big mango = (Number of Big mangoes)/(Total Number of mangoes)
= 7/(7+21)
= 7/28
Reducing the fraction to its lowest term,
= 1/4
b) Probability of selecting small mango = (Number of Small mangoes)/(Total Number of mangoes)
= 21/(7+21)
= 21/28
Reducing the fraction to its lowest term,
= 3/4
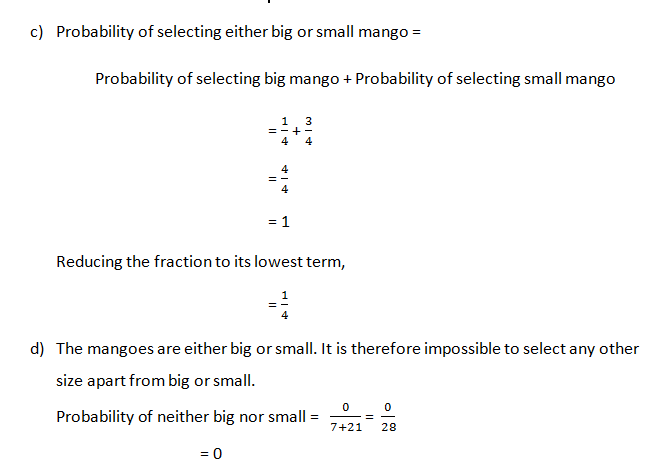
Probability of selecting either big or small mango =
Probability of selecting big mango + Probability of selecting small mango
= 1/4 + 3/4
= 4/4
= 1
Reducing the fraction to its lowest term,
= 1/4
The mangoes are either big or small. It is therefore impossible to select any other size apart from big or small.
Probability of neither big nor small = 0/(7+21) = 0/28
= 0
https://youtu.be/eFM5twmpu_c
EVALUATION:
A bag contains 5 white balls and 6 yellow balls. What is the probability that a ball picked from the bag at random is:
(a) White (b) Yellow (c) Either White or Yellow (d) Neither White nor Yellow
LESSON 15
Topic 3: Importance and Usefulness of Probability
Probability theory is applied in everyday life in risk assessment and in trade on commodity markets. Governments typically apply probabilistic methods in environmental regulation, where it is called pathway analysis. A good example is the effect of the perceived probability of any widespread Middle East conflict on oil prices—which have ripple effects in most economies. An assessment by a commodity trader that a war is more likely vs. less likely sends prices up or down, and signals other traders of that opinion.
Another application of probability theory in everyday life is reliability. Many consumer products, such as automobiles and consumer electronics, use reliability theory in product design to reduce the probability of failure. Failure probability may influence a manufacture's decisions on a product's warranty. The cache language model and other statistical language models that are used in natural language processing are also examples of applications of probability theory.
There are several major industries that are big users of probability. The first of those is the sports, and games industry. All sports and many other games rely heavily on the use of probabilities to predict winning combinations and numbers of winners.
Another major industry using probabilities is the insurance industry. All insurance rates are determined by the probability that a certain person of a certain age doing a certain activity will have an accident or a heart attack or get diabetes or die at a certain age.
Probability is also used for meteorology and weather forecasting. Every time the weather person says there's an 80% chance of snow, he or she has studied the weather patterns, applied the mathematics and science and formulas, and made the prediction.
Another area where probabilities are used, but may not be widely known, is in the area of research. Research is done in almost every field of study from agriculture to business trends to education to psychology to medicine. Even fashion and food follow trends that can be studied. The data is gathered and analyzed and predictions are made using probability.
https://youtu.be/_sY3ZRxhBaM
EVALUATION:
Briefly discuss the importance of probability.
LESSON 16
Sub-Topic 4: Examples of chance events – Ludo game, Tossing of coins etc
Chance is a word that is used in everyday life situation, mostly in games of luck where chances of a particular event taking place are discussed.
A person can have a chance of meeting a person or winning a game. A weak student has a chance to get good marks, if he studies. In very simple terms, chance is something that may happen, even if there were no scene of its happening. It can be seen that chance is a term that describes the likelihood of an event taking place.
There is a difference between Chance and Probability:
Probability is a separate field of study originated from the study of games of chances. Tossing a coin, spinning a wheel and rolling a dice in Ludo game are perfect examples. Chance is an everyday word used in a situation where we are talking about an event taking place whereas probability is a precise measurement of that chance. Probability is a special branch of mathematics that helps people to decide the percentage of likelihood of an event taking place whereas chances of an event taking place in daily life are merely opinions.
For example, in a game of Ludo, the probability of getting a six is 1/6. There are six numbers around a die: 1, 2, 3, 4, 5, 6. The probability of getting a 6 out of the six digits round a die is 1 out of 6.
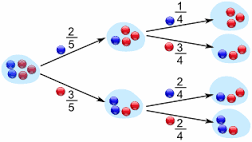
When a coin is tossed, there are two possible outcomes. It can be a head or a tail, which are both equally likely. If two coins are tossed, there can be two heads, two tails, or a head and a tail. It is tempting to say that there are three equally possible outcomes. But this would be wrong. You must think of the coins separately. It might be easier to imagine tossing one coin first and the other after (or even tossing the same coin twice, which has exactly the same effect). Or you could imagine two different values of coins, so they can be tossed apart. Now you can see that there are four possibilities: both heads, both tails, first coin a head and the second a tail, and first coin a tail and the second a head.
https://youtu.be/Ij25hzhDHXI
EXAMPLE:
A coin is tossed three times. The probability of obtaining at least one tail is?
Solution:
Probability of getting a head: 0.5
Probability of getting a tail: 0.5
The probability of not getting ANY tails = P (Head) x P (Head) x P (Head)
= 0.5 x 0.5 x 0.5
= 0.125
The probability of getting AT LEAST 1 tail = 1 - 0.125 = 0.875
Other examples of the probabilities of chance events include: probability of getting rain is ½ (or 50%), probability of passing a competitive exam is ½ (or 50%), probability of winning a football match is ½ (or 50%).
https://youtu.be/UoL_xrLha5s
EVALUATION:
A coin is tossed twice. What is the probability of getting a head and a tail?
What is the probability of getting a 5 from a Ludo die?
ASSIGNMENT:
New General Mathematics for Junior Secondary Schools 2 by M.F. Macrae et. al. Chapter 21 Exercise 21a Nos 1-2, Exercise 21b Nos 1-5, Exercise 21c Nos 1-6
New General Mathematics for Junior Secondary Schools 2 by M.F. Macrae et. al. Chapter 21 Pages 202 - 208
TOPIC: Probability: Review
CONTENT:
i. Concept and meaning of probability
ii. Occurrence of chance events in everyday life
iii. Importance and usefulness of probability
iv Examples of chance events – ludo game, tossing of coins etc
CONTENT:
i. Concept and meaning of Probability
Probability is a measure of the likelihood of a required outcome happening. The required outcomes are the required possibilities in an occurrence or happening.
In form of a fraction, Probability = (number of required outcomes)/(number of possible/total outcomes)
In other words, the likelihood of an event happening is called probability. Probability is 1 if it is certain that something will happen. Probability is 0 if it is certain that something cannot happen.
Probability is ordinarily used to describe an attitude of mind towards some proposition of whose truth we are not certain. The proposition of interest is usually of the form "Will a specific event occur?" The attitude of mind is of the form "How certain are we that the event will occur?" The certainty we adopt can be described in terms of a numerical measure and this number, between 0 and 1, is called probability. The higher the probability of an event, the more certain we are that the event will occur. Thus, probability in an applied sense is a measure of the likeliness that a (random) event will occur.
If the probability of something happening is x, then the probability of it not happening is 1 – x.
https://youtu.be/KzfWUEJjG18
EVALUATION:
What does probability mean to you? Briefly describe the term “probability”.
LESSON 14
Topic 2: Occurrence of chance events in everyday life
There are lots of these simple examples that we could be used to discuss probability. But chance events occur more often in everyday life. As you grow up you need to think about your actions and what the consequences of these actions will be. It's important to know how to use probability when you make decisions about your future.
There are many advertisements on TV for trading stocks which involve buying and selling shares from companies. Before buying a stock, there is need to investigate the company. If the company makes a lot of money with their product and if you own some of their stock, you may make more money, potentially more money than what you could earn at the bank as interest on your savings account. But if the company loses money, you may lose. People who work with company finances calculate the probability that a company should make money and is a good company to invest money in.
Another area of your life where probability is important is your health. For example, if you know that people in your family have heart disease and you develop high blood pressure when you are an adult then you know that you have a high probability of also having heart disease. You could be frightened by this high probability or you could live a healthier lifestyle that lowers your blood pressure and in turn lowers the probability of getting heart disease. In this case, you are using your understanding of probability to improve your health.
EXAMPLE – 1: Out of 200 buses, 40 were not involved in any accident in January. What is the probability that a bus will not be involved in accident in January?
Solution:
Required outcomes = Numbers of buses not involved in accident in January = 40
Possible outcomes = Number of buses altogether = 200
Probability of a bus not involved in accident in January = 40/200 = 1/5
EXAMPLE – 2: In a basket, there are two blue balls, three red balls and four green balls. What is the probability that a ball picked at random is:
Blue
Red
Green
Not Blue
Solution:
Random means not picked carefully or selected anyhow.
Probability of picking Blue ball = (Number of Blue balls)/(Total Number of balls)
= 2/9
Probability of picking Red ball = (Number of Blue balls)/(Total Number of balls)
= 3/9
Probability of picking Green ball = (Number of Green balls)/(Total Number of balls)
= 5/9
Probability of not picking Blue ball = 1 – Probability of picking Blue ball
= 1 - 5/9
= (9-5)/9
= 4/9
EXAMPLE – 3: A bucket contains 7 big mangoes and 21 small mangoes. What is the probability that a mango selected at random is:
Big
Small
Either
Neither
Solution:
a) Probability of selecting big mango = (Number of Big mangoes)/(Total Number of mangoes)
= 7/(7+21)
= 7/28
Reducing the fraction to its lowest term,
= 1/4
b) Probability of selecting small mango = (Number of Small mangoes)/(Total Number of mangoes)
= 21/(7+21)
= 21/28
Reducing the fraction to its lowest term,
= 3/4
Probability of selecting either big or small mango =
Probability of selecting big mango + Probability of selecting small mango
= 1/4 + 3/4
= 4/4
= 1
Reducing the fraction to its lowest term,
= 1/4
The mangoes are either big or small. It is therefore impossible to select any other size apart from big or small.
Probability of neither big nor small = 0/(7+21) = 0/28
= 0
https://youtu.be/eFM5twmpu_c
EVALUATION:
A bag contains 5 white balls and 6 yellow balls. What is the probability that a ball picked from the bag at random is:
(a) White (b) Yellow (c) Either White or Yellow (d) Neither White nor Yellow
LESSON 15
Topic 3: Importance and Usefulness of Probability
Probability theory is applied in everyday life in risk assessment and in trade on commodity markets. Governments typically apply probabilistic methods in environmental regulation, where it is called pathway analysis. A good example is the effect of the perceived probability of any widespread Middle East conflict on oil prices—which have ripple effects in most economies. An assessment by a commodity trader that a war is more likely vs. less likely sends prices up or down, and signals other traders of that opinion.
Another application of probability theory in everyday life is reliability. Many consumer products, such as automobiles and consumer electronics, use reliability theory in product design to reduce the probability of failure. Failure probability may influence a manufacture's decisions on a product's warranty. The cache language model and other statistical language models that are used in natural language processing are also examples of applications of probability theory.
There are several major industries that are big users of probability. The first of those is the sports, and games industry. All sports and many other games rely heavily on the use of probabilities to predict winning combinations and numbers of winners.
Another major industry using probabilities is the insurance industry. All insurance rates are determined by the probability that a certain person of a certain age doing a certain activity will have an accident or a heart attack or get diabetes or die at a certain age.
Probability is also used for meteorology and weather forecasting. Every time the weather person says there's an 80% chance of snow, he or she has studied the weather patterns, applied the mathematics and science and formulas, and made the prediction.
Another area where probabilities are used, but may not be widely known, is in the area of research. Research is done in almost every field of study from agriculture to business trends to education to psychology to medicine. Even fashion and food follow trends that can be studied. The data is gathered and analyzed and predictions are made using probability.
https://youtu.be/_sY3ZRxhBaM
EVALUATION:
Briefly discuss the importance of probability.
LESSON 16
Sub-Topic 4: Examples of chance events – Ludo game, Tossing of coins etc
Chance is a word that is used in everyday life situation, mostly in games of luck where chances of a particular event taking place are discussed.
A person can have a chance of meeting a person or winning a game. A weak student has a chance to get good marks, if he studies. In very simple terms, chance is something that may happen, even if there were no scene of its happening. It can be seen that chance is a term that describes the likelihood of an event taking place.
There is a difference between Chance and Probability:
Probability is a separate field of study originated from the study of games of chances. Tossing a coin, spinning a wheel and rolling a dice in Ludo game are perfect examples. Chance is an everyday word used in a situation where we are talking about an event taking place whereas probability is a precise measurement of that chance. Probability is a special branch of mathematics that helps people to decide the percentage of likelihood of an event taking place whereas chances of an event taking place in daily life are merely opinions.
For example, in a game of Ludo, the probability of getting a six is 1/6. There are six numbers around a die: 1, 2, 3, 4, 5, 6. The probability of getting a 6 out of the six digits round a die is 1 out of 6.
When a coin is tossed, there are two possible outcomes. It can be a head or a tail, which are both equally likely. If two coins are tossed, there can be two heads, two tails, or a head and a tail. It is tempting to say that there are three equally possible outcomes. But this would be wrong. You must think of the coins separately. It might be easier to imagine tossing one coin first and the other after (or even tossing the same coin twice, which has exactly the same effect). Or you could imagine two different values of coins, so they can be tossed apart. Now you can see that there are four possibilities: both heads, both tails, first coin a head and the second a tail, and first coin a tail and the second a head.
https://youtu.be/Ij25hzhDHXI
EXAMPLE:
A coin is tossed three times. The probability of obtaining at least one tail is?
Solution:
Probability of getting a head: 0.5
Probability of getting a tail: 0.5
The probability of not getting ANY tails = P (Head) x P (Head) x P (Head)
= 0.5 x 0.5 x 0.5
= 0.125
The probability of getting AT LEAST 1 tail = 1 - 0.125 = 0.875
Other examples of the probabilities of chance events include: probability of getting rain is ½ (or 50%), probability of passing a competitive exam is ½ (or 50%), probability of winning a football match is ½ (or 50%).
https://youtu.be/UoL_xrLha5s
EVALUATION:
A coin is tossed twice. What is the probability of getting a head and a tail?
What is the probability of getting a 5 from a Ludo die?
ASSIGNMENT:
New General Mathematics for Junior Secondary Schools 2 by M.F. Macrae et. al. Chapter 21 Exercise 21a Nos 1-2, Exercise 21b Nos 1-5, Exercise 21c Nos 1-6
New General Mathematics for Junior Secondary Schools 2 by M.F. Macrae et. al. Chapter 21 Pages 202 - 208
WEEK 5
LESSON 17
TOPIC: PROBABILITY
TOPIC 1: PROBABILITY OF CHANCE OF EVENTS, EXPERIMENTAL PROBABILITY
Probability is the measure of the result or outcomes of expectation (events) in numerical form. The number to be assigned normally stands between 0 and 1.When the probability is zero, it means the event will not happen, while of one shows that certainly the event will happen and the probability that event may happen is half(½).
The probability of a particular outcome is defined as
The number of favourable outcomes
Total number of outcome
Experimental probability
Experimental probability bases its result on the actual test (experiment) carried out.The outcome will therefore be based on the number of trials (experiment) carried out.
Probability=number of required outcomes/number of possible outcomes
An event is a possible outcome or combination of an outcomes of an experiment, e.g.(H) is the event that head appears (T)is the event that tail will appear in a tossed coin. For a tossed coin, the probability of obtaining a head is equal to the probability of obtaining a tail, hence (H) and (T) are equally likely.
https://youtu.be/ocQcP9wKAB0
Example 1
Find the probability of obtaining a 4 on a thrown die.
Solution
Likely numbers to throw are :1,2,3,4,5,6
Event number is 4, i.e number of required outcomes which occur once
While total number is 6 i.e required outcomes
Probability of obtaining a 4 i.e P(4) =1/6
Example 2
It is known that out of every 1000 new cars, 50 develop a mechanical fault in the first three months. What is the of buying a car that will develop a mechanical fault within 3 months.
Solution
Required outcomes is number of cars developing faults = 50
divided by...
Total number of outcomes is number of cars altogether = 1000
Probability of buying a faulty car = 50/1000
= 1/20
Example 3: A market trader has 100 oranges for sale.Four of them are bad. What is the probability that an orange chosen at random is good?
At random means without carefully choosing
Four out of 100 oranges are bad, i.e 96 out of 100 oranges are good.
Probability of getting a good orange = 96/100 = 24/25
Method 2
Probability of getting a bad orange= 4/100 = 1/25
Probability of getting a good 0range = 1-1/25 = 24/25
Example 4
There are 7 red balls, 8 white balls and 5 blue balls in a box.A ball is selected at random from the box. Find the probability that the ball is (a)white (b)red (c)blue or red (d)neither red nor white (e) green.
Solution
Total number of balls = 7 + 8 + 5 =20
Number of white ball=8
Probability 0f selecting a white balls= 8/20
b. Number of red balls = 7
probability of selecting a red ball = 7/20
c. Number of blue and red = 5+7=12
probability of selecting a blue or red =12/20 = 3/5
d. neither a red nor white, then it must be blue =5/20 = 1/4
e. there no green balls, probability of selecting a green ball = 0
https://youtu.be/3z8exfuNMZ4
EVALUATION:
A trader has 100 mangoes for sale. Twenty of them are unripe. Another five of them are bad. If a mango is picked at random, find the probability that it is a unripe b bad c neither unripe nor bad?
If 20 of the mangoes were chosen at random, how many would you expect to be d unripe e bad
ASSIGNMENT:
New general mathematics for junior secondary school UBE Edition page 202-205
New general mathematics book 2 exercise 21c 1-20
WEEK 6
LESSON 18
TOPIC: Distance and Time graph
SUB-TOPIC: Real life situations on graph
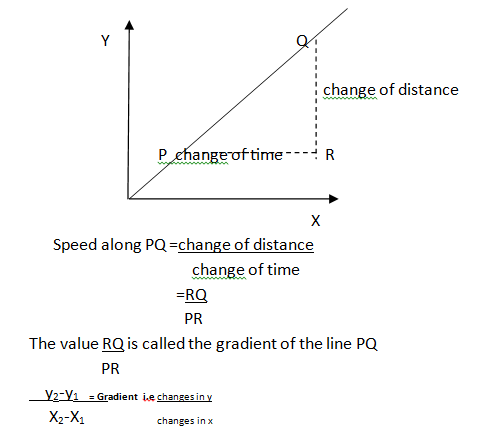
Gradient
The gradient of a distance-time graph gives a measure of the acceleration of the object. Acceleration is positive when the speed is increasing and negative (i.e. deceleration) when the speed is decreasing.PQR is any right-angled triangle drawn on the travel graph. Between P and Q the time changes from P to R and the distance changes from R to Q.
LINEAR GRAPHS
https://youtu.be/ykeCKm9JqSA
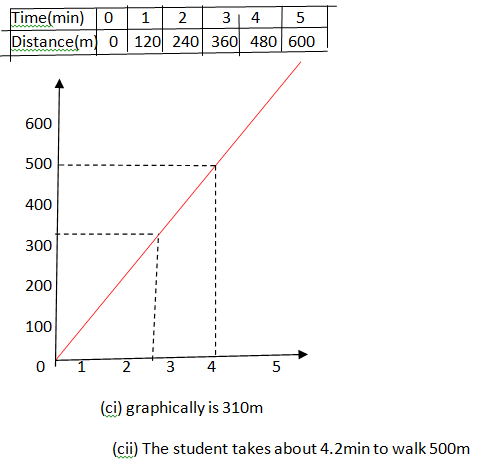
Example 2
A student walks along a road at a speed of 120m per minute
(a) Make a table of values showing how far the student has walked after 0,1,2,3,4,5 minutes
(b) Using a scale of 1cm to 1min on the horizontal axis and 1cm to 100m on the vertical axis, draw a graph of this information.
(c) Use the graph to find (i) how far the student has walked after 2.6min, (ii) how long it takes the student to walk 500m.
In tabular form
Time(min) 0 1 2 3 4 5
Distance(m) 0 120 240 360 480 600
https://youtu.be/ruTcNElXdzQ
EVALUATION:
1. New general mathematics for junior secondary school exercise 14a, 1-10 page 121
LESSON 19
Speed-time graphs
It is also known as velocity-time graph, show how the speed of an object varies with time during a journey.
https://youtu.be/LJctqrA9jhU
ASSIGNMENT:
New general mathematics for junior secondary school UBE Edition book 2 page 119-128
New general mathematics for junior secondary school book 2 exercise 14f question 1-6 page 134-135
TOPIC: Distance and Time graph
SUB-TOPIC: Real life situations on graph
Gradient
The gradient of a distance-time graph gives a measure of the acceleration of the object. Acceleration is positive when the speed is increasing and negative (i.e. deceleration) when the speed is decreasing.PQR is any right-angled triangle drawn on the travel graph. Between P and Q the time changes from P to R and the distance changes from R to Q.
LINEAR GRAPHS
https://youtu.be/ykeCKm9JqSA
Example 2
A student walks along a road at a speed of 120m per minute
(a) Make a table of values showing how far the student has walked after 0,1,2,3,4,5 minutes
(b) Using a scale of 1cm to 1min on the horizontal axis and 1cm to 100m on the vertical axis, draw a graph of this information.
(c) Use the graph to find (i) how far the student has walked after 2.6min, (ii) how long it takes the student to walk 500m.
In tabular form
Time(min) 0 1 2 3 4 5
Distance(m) 0 120 240 360 480 600
https://youtu.be/ruTcNElXdzQ
EVALUATION:
1. New general mathematics for junior secondary school exercise 14a, 1-10 page 121
LESSON 19
Speed-time graphs
It is also known as velocity-time graph, show how the speed of an object varies with time during a journey.
https://youtu.be/LJctqrA9jhU
ASSIGNMENT:
New general mathematics for junior secondary school UBE Edition book 2 page 119-128
New general mathematics for junior secondary school book 2 exercise 14f question 1-6 page 134-135
WEEK 7
LESSON 20
TOPIC: Revision on angles and polygon
SUB-TOPIC: Types of angles and polygon
ANGLES
Angles are the distance or change in direction between two lines or surfaces diverging from the same point, measure in degree(0)
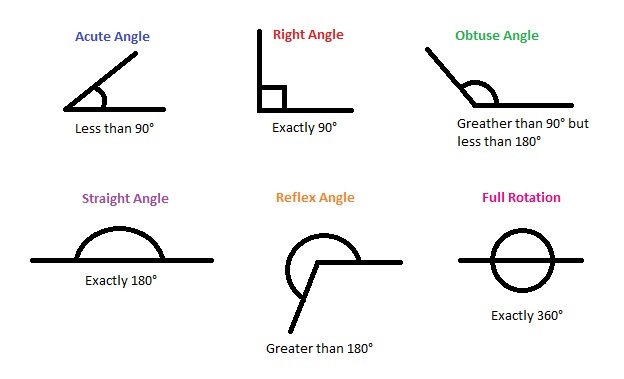
Name of angles
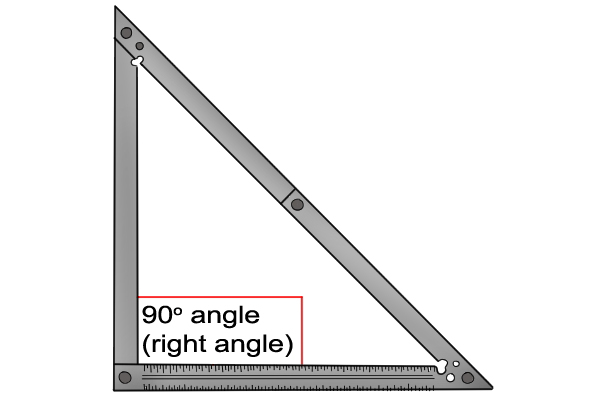
1. Right Angles: This is an angle whose value is exactly 90o .It is a quarter of a revolution
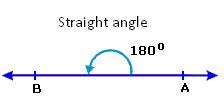
2. A Straight Angle: is an angle of size 1800.
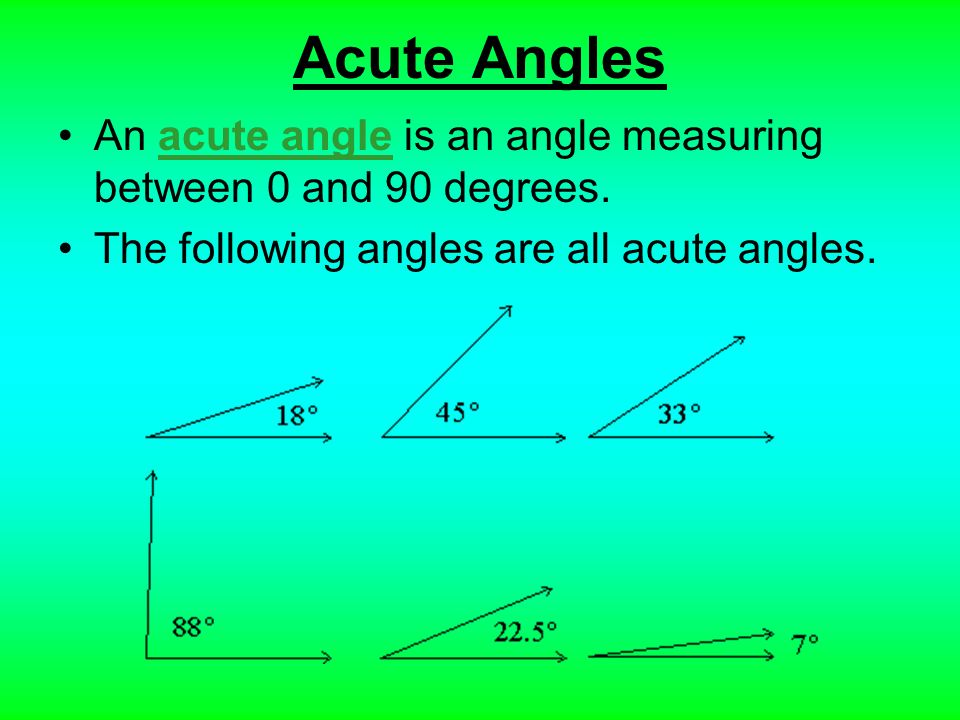
3. Acute Angle: This is an angle whose value is less than a right angle, i.e angles less 900
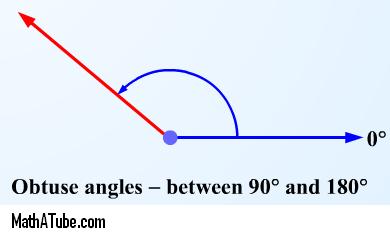
4. Obtuse Angle: This is the one which is greater than 900 but less than 1800 .
5. Reflex Angle: It is an angle which is between 1800 and 3600
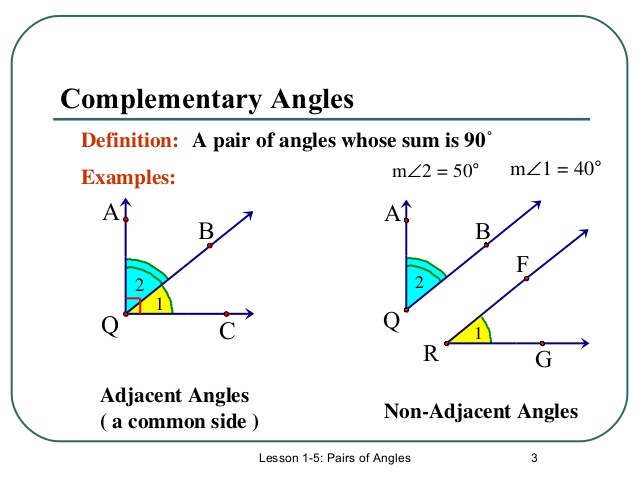
6. Complementary Angles: Two angles are said to be complementary if their sum is equal to 900 e.g. the complement of 26o is 900 - 260 =640
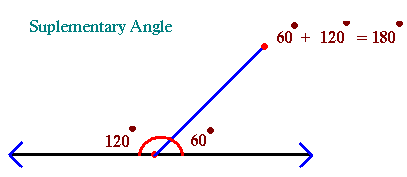
7. Supplementary Angles: When the sum of two angles is equal to 1800 they are said to be supplementary. Therefore the supplement of 260 is 1800- 260 = 1540
https://youtu.be/WH6RsZrSOUg
LESSON 21
Angles between lines (revision)
This section revises the properties of angles (i) meeting at a point, (ii) at the points where a transversal crosses parallel lines.
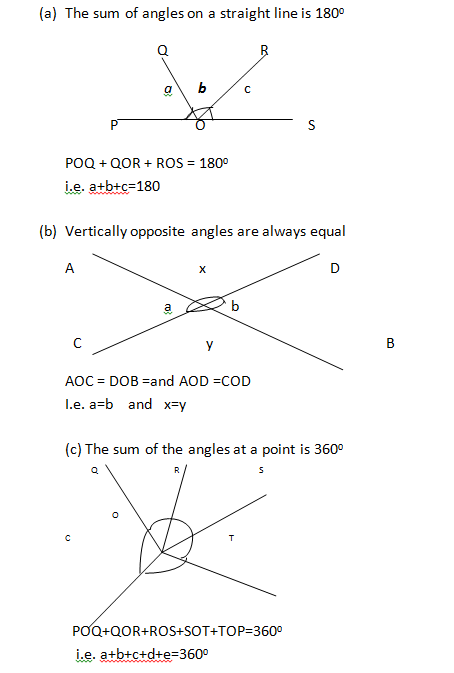
(a) The sum of angles on a straight line is 1800
https://youtu.be/e4o7X6LyX-I
(d) When a transversal crosses parallel lines, corresponding angles are equal.
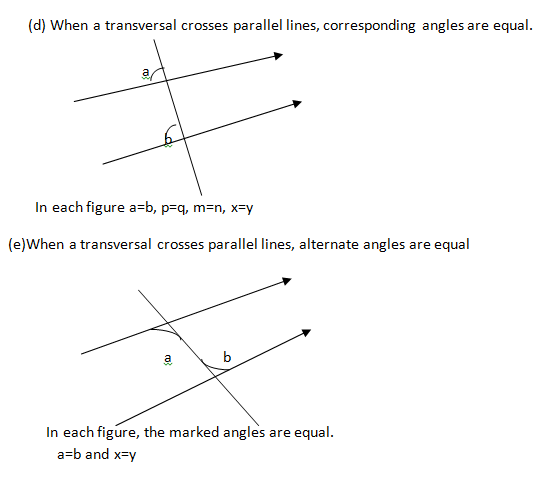
EVALUATION :
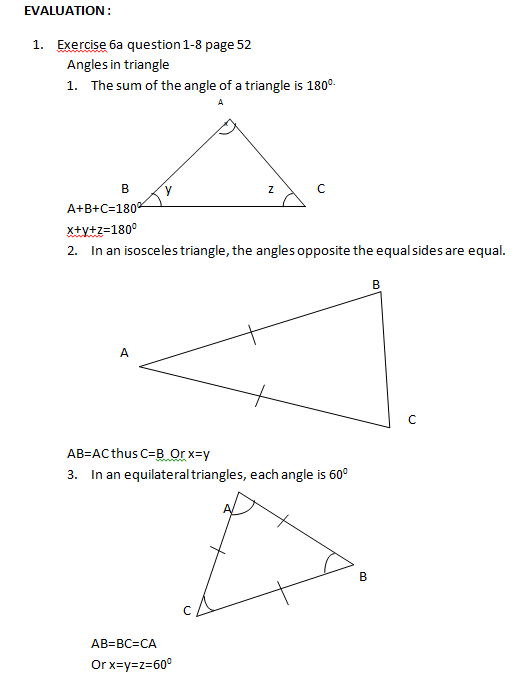
1. Exercise 6a question 1-8 page 52
https://youtu.be/DGKwdHMiqCg
Evaluation 2
Exercise 6b question 1-8 page 53
LESSON 22
Angles in a quadrilateral
Any quadrilateral can be divided into two triangles by drawing its diagonal.
P+q+r =1800 (angles of ABD)
X+y+z=1800
Thus
P+q+r+x+y+z=3600
https://youtu.be/y9udtA3cPgU
LESSON 23
Angle in a polygon
A polygon is any closed figure which is bounded by at least three straight lines. It implies that a polygon can have more than three sides. It has thus:
NUMBER OF SIDES NAME OF POLYGON
3 = Triangle
4 = Quadrilateral
5 = Pentagon
6 = Hexagon
7 = Heptagon
8 = Octagon
9 = Nonagon
10 = Decagon
11 = Undecagon
12 = Duodecagon
A regular polygon has all sides and all angles equal.
https://youtu.be/IaoZhhx_I9s
https://youtu.be/WH6RsZrSOUg
Types of Polygon
Polygon can also be classified in the following ways
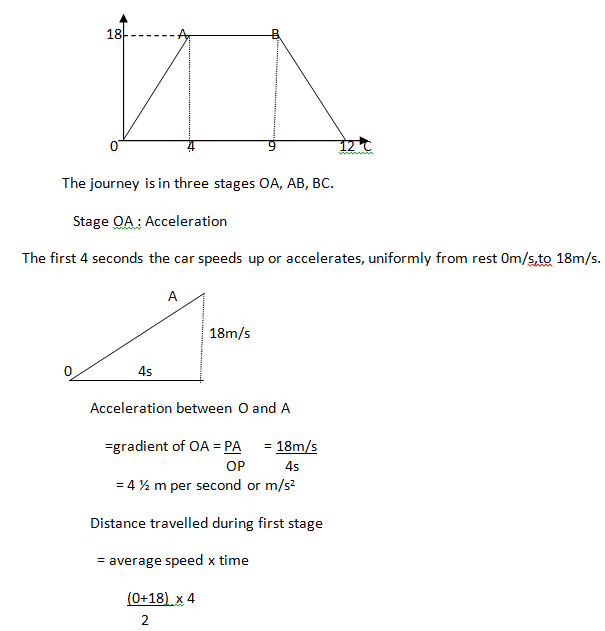
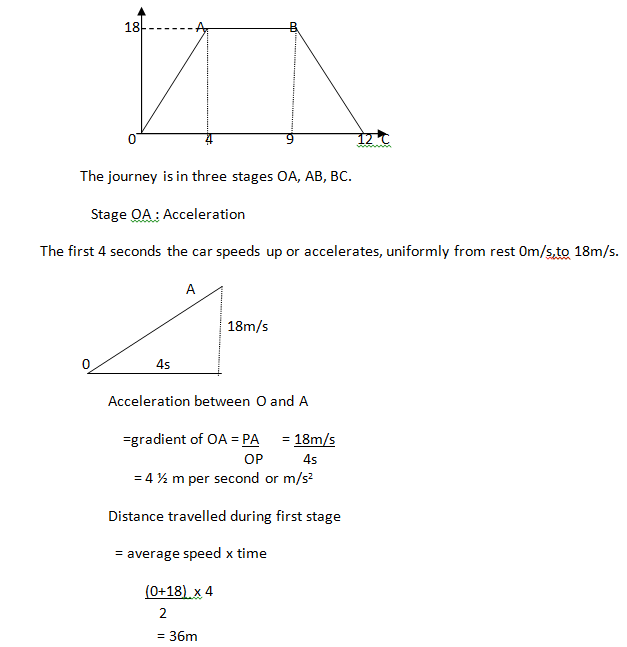
(a) CONVEX POLYGON: Each of its interior angles is less than 1800 .
(b) RE-ENTRANT POLYGON: One or more of its interior angles is reflex i.e. greater than 1800
(c) EQUILATERAL POLYGON: All sides are equal.
(d) EQUIANGULAR POLYGON: All its angles are equal
(e) REGULAR POLYGON: All sides are equal, all angles are also equal.
Sum of the interior angles of a polygon
For polygon n sides there will be n-2 triangles. The sum of angles of triangle is 1800 or two right angles.
Thus, in degree :
The sum of the angles of an n-sided polygon =(n-2)x1800
https://youtu.be/FO8cuQmWsrE
Example
Calculate the size of each angle of a regular octagon.
Solution
Number of sides of octagon is 8
The sum of angles of polygon = (n-2)x1800
(8-2)x 1800 =6x180 = 10800
There are 8 angles
Each angle = 10800/8 =1350
ASSIGNMENT 1: New general mathematics for junior secondary school book 2 page 51-58
ASSIGNMENT 2: Exercise 6d question 1-10 page 56-57
TOPIC: Revision on angles and polygon
SUB-TOPIC: Types of angles and polygon
ANGLES
Angles are the distance or change in direction between two lines or surfaces diverging from the same point, measure in degree(0)
Name of angles
1. Right Angles: This is an angle whose value is exactly 90o .It is a quarter of a revolution
2. A Straight Angle: is an angle of size 1800.
3. Acute Angle: This is an angle whose value is less than a right angle, i.e angles less 900
4. Obtuse Angle: This is the one which is greater than 900 but less than 1800 .
5. Reflex Angle: It is an angle which is between 1800 and 3600
6. Complementary Angles: Two angles are said to be complementary if their sum is equal to 900 e.g. the complement of 26o is 900 - 260 =640
7. Supplementary Angles: When the sum of two angles is equal to 1800 they are said to be supplementary. Therefore the supplement of 260 is 1800- 260 = 1540
https://youtu.be/WH6RsZrSOUg
LESSON 21
Angles between lines (revision)
This section revises the properties of angles (i) meeting at a point, (ii) at the points where a transversal crosses parallel lines.
(a) The sum of angles on a straight line is 1800
https://youtu.be/e4o7X6LyX-I
(d) When a transversal crosses parallel lines, corresponding angles are equal.
EVALUATION :
1. Exercise 6a question 1-8 page 52
https://youtu.be/DGKwdHMiqCg
Evaluation 2
Exercise 6b question 1-8 page 53
LESSON 22
Angles in a quadrilateral
Any quadrilateral can be divided into two triangles by drawing its diagonal.
P+q+r =1800 (angles of ABD)
X+y+z=1800
Thus
P+q+r+x+y+z=3600
https://youtu.be/y9udtA3cPgU
LESSON 23
Angle in a polygon
A polygon is any closed figure which is bounded by at least three straight lines. It implies that a polygon can have more than three sides. It has thus:
NUMBER OF SIDES NAME OF POLYGON
3 = Triangle
4 = Quadrilateral
5 = Pentagon
6 = Hexagon
7 = Heptagon
8 = Octagon
9 = Nonagon
10 = Decagon
11 = Undecagon
12 = Duodecagon
A regular polygon has all sides and all angles equal.
https://youtu.be/IaoZhhx_I9s
https://youtu.be/WH6RsZrSOUg
Types of Polygon
Polygon can also be classified in the following ways
(a) CONVEX POLYGON: Each of its interior angles is less than 1800 .
(b) RE-ENTRANT POLYGON: One or more of its interior angles is reflex i.e. greater than 1800
(c) EQUILATERAL POLYGON: All sides are equal.
(d) EQUIANGULAR POLYGON: All its angles are equal
(e) REGULAR POLYGON: All sides are equal, all angles are also equal.
Sum of the interior angles of a polygon
For polygon n sides there will be n-2 triangles. The sum of angles of triangle is 1800 or two right angles.
Thus, in degree :
The sum of the angles of an n-sided polygon =(n-2)x1800
https://youtu.be/FO8cuQmWsrE
Example
Calculate the size of each angle of a regular octagon.
Solution
Number of sides of octagon is 8
The sum of angles of polygon = (n-2)x1800
(8-2)x 1800 =6x180 = 10800
There are 8 angles
Each angle = 10800/8 =1350
ASSIGNMENT 1: New general mathematics for junior secondary school book 2 page 51-58
ASSIGNMENT 2: Exercise 6d question 1-10 page 56-57
WEEK 9
LESSON 24
TOPIC: Perimeter and area of sector
REFERENCE BOOK: Macmillan Progressive Mathematics for JS1, Page 104.
BEHAVIOURAL OBJECTIVES: At the end of this lesson, students should be able to find the length of arc of given sectors.
CONTENTS
Length of arc = Ɵ/360 x 2pie r
Example: In a circle of radius 12cm find the length of arc which subtends 105 degree at the centre.
Ɵ = 105
R = 12cm
Length of arc = 105/360 x 2 x 3.14 = 12
= 22cm
Example 2:
If an arc of length 33cm subtends 70 degree at the centre of a circle, find the radius of the circle.
Length of arc = Ɵ /360 x 2 pie x r
Then 33 = (70 x 2 x 22 x r)/360 x 7
11r/9 = 33
11r =9 x 33
R =27.
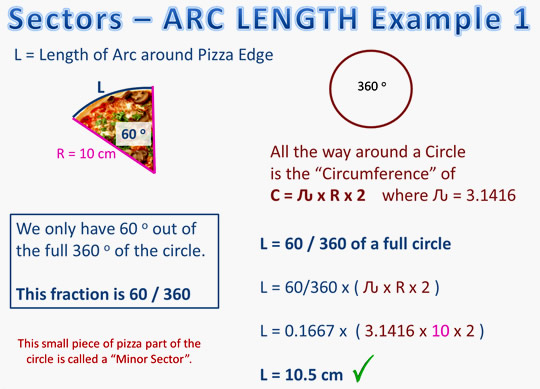

EVALUATION: In a circle of radius 9cm find the length of arc which subtends an angle of 105 degree at the centre.
(2) A circle of radius 12cm subtends an angle of 84 degree at the centre. Find the length of arc.
https://youtu.be/HauAW45VLzo
ASSIGNMENT: In a circle of radius 15cm find the length of an arc which subtends 91 degree at the centre.
(2) If an arc of length 44cm subtends an angle of 210 degree at the centre, find the radius of the circle.
further studies
Study More...
LESSON 25
TOPIC: Perimeter of sector
REFERENCE BOOK: Macmillan Progressive Mathematics for JS2, Page 104.
BEHAVIOURAL OBJECTIVES: At the end of this lesson, students should be able to find the perimeter of sectors.
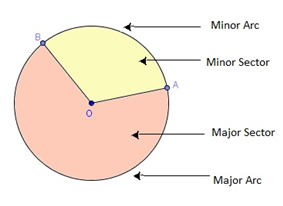
CONTENTS
Perimeter of sector = (Ɵ /360 x 2pie x r) + 2r
Example: Find the perimeter of a sector which makes an angle 60 degree at the centre of a circle of radius 21cm.
P = (60/360 x 2 x 3.14 x 21) + 2 x 21
P = 22 + 42
P = 64cm
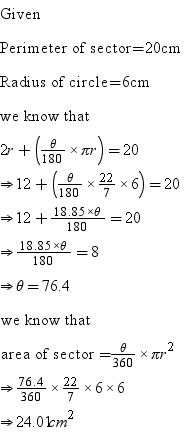
EVALUATION Find the perimeter of a sector which makes an angle 150 degree at the centre of a circle of radius 12cm.
(2) Find the perimeter of a sector which makes an angle 120 degree at the centre of a circle of radius 9cm.
https://www.youtube.com/watch?v=AAY1bsazcgM
https://www.youtube.com/watch?v=j64NyaCbcGU
ASSIGNMENT
(1) Find the perimeter of a sector which makes angle 30 degree at the centre of a circle of radius 21cm.
(2) Find the perimeter of a sector which makes angle 60 degree at the centre of a circle of radius 35cm.
LESSON 26
TOPIC: Area of sector
REFERENCE BOOK: Macmillan Progressive Mathematics for JS1, Page 104.
BEHAVIOURAL OBJECTIVES: At the end of this lesson, students should be able to find the area of a sector.
CONTENTS
Area of sector = Ɵ /360 x pie x r x r
Example: Find the area of the sector of a circle of radius 7cm which subtends an angle of 60 degree at the centre.
A = 60/360 x 22/7 x 7 x 7
A = 77/3
A = 25.66
Example 2:
Find the area of the sector of a circle of radius 14cm which subtends an angle of 90 degree at the centre.
A = Ɵ /360 x pie x r x r
Ɵ = 90
R = 14cm
A = 90/360 x 22/7 x 14 x 14
A = 154
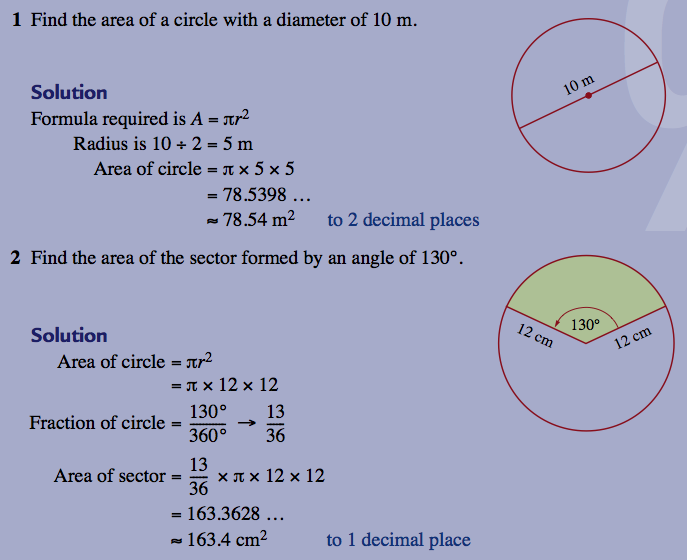
https://www.youtube.com/watch?v=xCdxURXMdFY
https://www.youtube.com/watch?v=tD6wigYAYMk
EVALUATION:
(1) Find the area of a sector of a circle of radius 21cm which subtends an angle of 30 degree at the centre.
(2) Find the area of sector of a circle of radius 3.5cm which subtends an angle of 120 degree at the centre.
ASSIGNMENT
(1) Find the area of a sector of a circle of radius 28cm which subtends an angle of 120 degree at the centre.
(2) Find the area a sector of a circle of radius 10cm which subtends an angle of 45 degree at the centre.
LESSON 27
TOPIC: Circumference of a circle.
REFERENCE BOOK: Macmillan Progressive Mathematics for JS2, Page 104
BEHAVIOURAL OBJECTIVES: At the end of this lesson, students should be able to calculate the circumference of a circle.
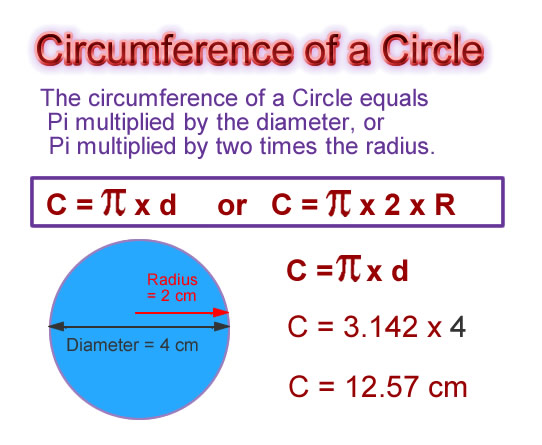
CONTENTS
Circumference of circle = 2 pie r or pie x D
Example: Find the perimeter of a circle of radius 7cm.
C = 2pie r
R = 22/7
C = 2 x 22/7 x 7
C = 44cm
Example 2:
Find the perimeter of a semi- circle of radius 14cm.
C = PIE x R + 2R
C =(22/7 x 14) + 2 x 14
C =44 + 28
C = 72cm
Example 3:
The circumference of a circle is 44cm. Find the radius of the circle.
C = 2pie r
44 = 2 x 22/7 x r
44 = 44r/7
44r = 7 x 44
R = (7 x 44)/44
R = 7cm.
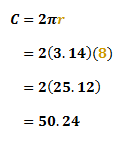
https://www.youtube.com/watch?v=O-cawByg2aA
https://www.youtube.com/watch?v=riNAA-jx0u8
EVALUATION:
(1) Find the perimeter of a circle of radius 21cm.
(2) Find the perimeter of a circle of radius 35cm.
(3) The circumference of a circle is 88cm. Find its radius.
ASSIGNMENT
(1) Find the circumference of a circle of radius 42cm.
(2) Find the circumference of a circle of diameter 14cm.
(3) The circumference of a circle is 220cm, find its diameter.
further studies
Study More...
practice test
Practice more...
Practice More...
Practice More...
TOPIC: Perimeter and area of sector
REFERENCE BOOK: Macmillan Progressive Mathematics for JS1, Page 104.
BEHAVIOURAL OBJECTIVES: At the end of this lesson, students should be able to find the length of arc of given sectors.
CONTENTS
Length of arc = Ɵ/360 x 2pie r
Example: In a circle of radius 12cm find the length of arc which subtends 105 degree at the centre.
Ɵ = 105
R = 12cm
Length of arc = 105/360 x 2 x 3.14 = 12
= 22cm
Example 2:
If an arc of length 33cm subtends 70 degree at the centre of a circle, find the radius of the circle.
Length of arc = Ɵ /360 x 2 pie x r
Then 33 = (70 x 2 x 22 x r)/360 x 7
11r/9 = 33
11r =9 x 33
R =27.
EVALUATION: In a circle of radius 9cm find the length of arc which subtends an angle of 105 degree at the centre.
(2) A circle of radius 12cm subtends an angle of 84 degree at the centre. Find the length of arc.
https://youtu.be/HauAW45VLzo
ASSIGNMENT: In a circle of radius 15cm find the length of an arc which subtends 91 degree at the centre.
(2) If an arc of length 44cm subtends an angle of 210 degree at the centre, find the radius of the circle.
further studies
Study More...
LESSON 25
TOPIC: Perimeter of sector
REFERENCE BOOK: Macmillan Progressive Mathematics for JS2, Page 104.
BEHAVIOURAL OBJECTIVES: At the end of this lesson, students should be able to find the perimeter of sectors.
CONTENTS
Perimeter of sector = (Ɵ /360 x 2pie x r) + 2r
Example: Find the perimeter of a sector which makes an angle 60 degree at the centre of a circle of radius 21cm.
P = (60/360 x 2 x 3.14 x 21) + 2 x 21
P = 22 + 42
P = 64cm
EVALUATION Find the perimeter of a sector which makes an angle 150 degree at the centre of a circle of radius 12cm.
(2) Find the perimeter of a sector which makes an angle 120 degree at the centre of a circle of radius 9cm.
https://www.youtube.com/watch?v=AAY1bsazcgM
https://www.youtube.com/watch?v=j64NyaCbcGU
ASSIGNMENT
(1) Find the perimeter of a sector which makes angle 30 degree at the centre of a circle of radius 21cm.
(2) Find the perimeter of a sector which makes angle 60 degree at the centre of a circle of radius 35cm.
LESSON 26
TOPIC: Area of sector
REFERENCE BOOK: Macmillan Progressive Mathematics for JS1, Page 104.
BEHAVIOURAL OBJECTIVES: At the end of this lesson, students should be able to find the area of a sector.
CONTENTS
Area of sector = Ɵ /360 x pie x r x r
Example: Find the area of the sector of a circle of radius 7cm which subtends an angle of 60 degree at the centre.
A = 60/360 x 22/7 x 7 x 7
A = 77/3
A = 25.66
Example 2:
Find the area of the sector of a circle of radius 14cm which subtends an angle of 90 degree at the centre.
A = Ɵ /360 x pie x r x r
Ɵ = 90
R = 14cm
A = 90/360 x 22/7 x 14 x 14
A = 154
https://www.youtube.com/watch?v=xCdxURXMdFY
https://www.youtube.com/watch?v=tD6wigYAYMk
EVALUATION:
(1) Find the area of a sector of a circle of radius 21cm which subtends an angle of 30 degree at the centre.
(2) Find the area of sector of a circle of radius 3.5cm which subtends an angle of 120 degree at the centre.
ASSIGNMENT
(1) Find the area of a sector of a circle of radius 28cm which subtends an angle of 120 degree at the centre.
(2) Find the area a sector of a circle of radius 10cm which subtends an angle of 45 degree at the centre.
LESSON 27
TOPIC: Circumference of a circle.
REFERENCE BOOK: Macmillan Progressive Mathematics for JS2, Page 104
BEHAVIOURAL OBJECTIVES: At the end of this lesson, students should be able to calculate the circumference of a circle.
CONTENTS
Circumference of circle = 2 pie r or pie x D
Example: Find the perimeter of a circle of radius 7cm.
C = 2pie r
R = 22/7
C = 2 x 22/7 x 7
C = 44cm
Example 2:
Find the perimeter of a semi- circle of radius 14cm.
C = PIE x R + 2R
C =(22/7 x 14) + 2 x 14
C =44 + 28
C = 72cm
Example 3:
The circumference of a circle is 44cm. Find the radius of the circle.
C = 2pie r
44 = 2 x 22/7 x r
44 = 44r/7
44r = 7 x 44
R = (7 x 44)/44
R = 7cm.
https://www.youtube.com/watch?v=O-cawByg2aA
https://www.youtube.com/watch?v=riNAA-jx0u8
EVALUATION:
(1) Find the perimeter of a circle of radius 21cm.
(2) Find the perimeter of a circle of radius 35cm.
(3) The circumference of a circle is 88cm. Find its radius.
ASSIGNMENT
(1) Find the circumference of a circle of radius 42cm.
(2) Find the circumference of a circle of diameter 14cm.
(3) The circumference of a circle is 220cm, find its diameter.
further studies
Study More...
practice test
Practice more...
Practice More...
Practice More...
WEEK 10
TOPIC: LINEAR INEQUALITY
SUBTOPIC: GRAPHS OF LINEAR INEQUALITY IN TWO VARIABLE
REVISION: Inequality is a mathematical statement that compares two expressions.
Examples: Solve the following inequalities (a) 3x+13<1 (b) 6x – 2 < 2x + 8
Solution: (a) 3x + 13 < 1
Collecting like terms
3x<1-13
3x < -12
Divide both sides by 3
3x/3 < -12/3
X < -4
(b) 6x-2<2x+8
Collecting like terms
6x-2x<8+2
4x<10
Divide both sides by 4
4x/4 < 10/4
X < 2 ½
Graphs of linear equation in two variables
https://www.youtube.com/watch?v=cskHdgwB5k8
An inequality involving two variables (e.g. x and y) is represented graphically as whole regions in a (2-dimensional) plane, see Example
Graph the following inequalities.
(a) 4x – y ≤ 8
(b) x≤0, y>x
Solutions:
(a) 4x – y ≤ 8
Let x = 0 then, 4(0) – y = 8
Y = -8
Also let y=0 then, 4x – 0 =8
X = 2
(0,-8) (2,0) 4x-y≤8
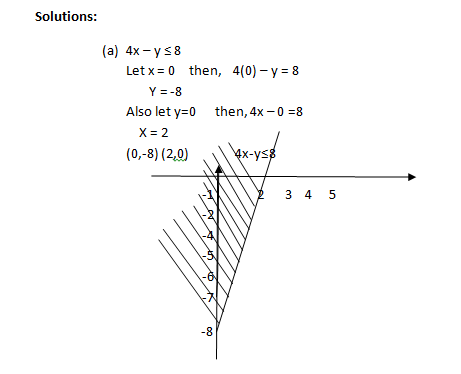
(b)Points lying on the y-axis (line x= 0) and to the left of the y-axis satisfy x≤0 while points lying above the line y=x satisfy y>x. Thus the common region (shaded region) satisfies the inequality x≤0,y>x.
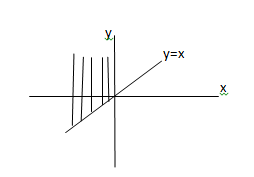
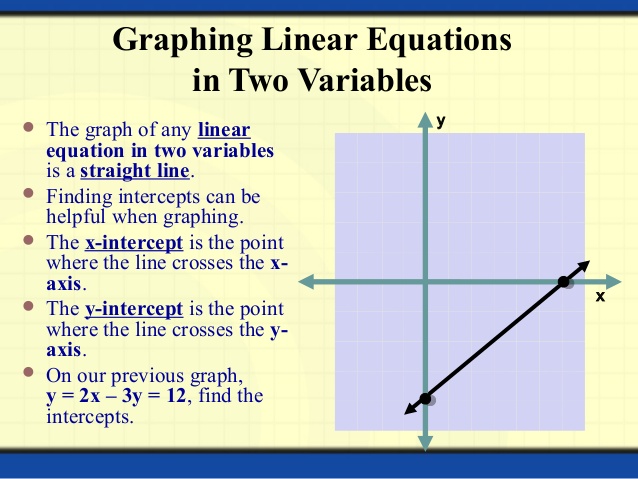
EVALUATION:
Solve the following inequalities:
(a) X-3>5
(b) 3x+3>9
(c) 3a-8≥5a
ASSIGNMENT: New general mathematics UBE Edition page 209-213
Solve the inequalities
(a) 4-3x≤10
(b) 12≥3(2y-3)
(c) X+7<2x+4
Graph the following inequalities
(d) X>2,y>1
(e) x≤1,y>x
(f) 3x+2y>12
SUBTOPIC: GRAPHS OF LINEAR INEQUALITY IN TWO VARIABLE
REVISION: Inequality is a mathematical statement that compares two expressions.
Examples: Solve the following inequalities (a) 3x+13<1 (b) 6x – 2 < 2x + 8
Solution: (a) 3x + 13 < 1
Collecting like terms
3x<1-13
3x < -12
Divide both sides by 3
3x/3 < -12/3
X < -4
(b) 6x-2<2x+8
Collecting like terms
6x-2x<8+2
4x<10
Divide both sides by 4
4x/4 < 10/4
X < 2 ½
Graphs of linear equation in two variables
https://www.youtube.com/watch?v=cskHdgwB5k8
An inequality involving two variables (e.g. x and y) is represented graphically as whole regions in a (2-dimensional) plane, see Example
Graph the following inequalities.
(a) 4x – y ≤ 8
(b) x≤0, y>x
Solutions:
(a) 4x – y ≤ 8
Let x = 0 then, 4(0) – y = 8
Y = -8
Also let y=0 then, 4x – 0 =8
X = 2
(0,-8) (2,0) 4x-y≤8
(b)Points lying on the y-axis (line x= 0) and to the left of the y-axis satisfy x≤0 while points lying above the line y=x satisfy y>x. Thus the common region (shaded region) satisfies the inequality x≤0,y>x.
EVALUATION:
Solve the following inequalities:
(a) X-3>5
(b) 3x+3>9
(c) 3a-8≥5a
ASSIGNMENT: New general mathematics UBE Edition page 209-213
Solve the inequalities
(a) 4-3x≤10
(b) 12≥3(2y-3)
(c) X+7<2x+4
Graph the following inequalities
(d) X>2,y>1
(e) x≤1,y>x
(f) 3x+2y>12